
HEURISTICS: Rent Always Goes Up
This is No. 2 of the six-part real estate pro forma series.

This is Heuristics - where assumptions are called out and broken down so that you can invest with greater clarity.
The past three years have been a multi-front stress test of assumptions for commercial real estate. This series will cover some of the most common failure points where flawed assumptions and seemingly small numerical changes can make a good deal go bad.
This is No. 2 in the six-part series.
No. 1 presented the pro forma and market metrics. Read this first.
In 2020 and 2021, asking rents on Sunbelt apartments were rising at double-digit annual rates. Phoenix was up 24%. Tampa was up 22%. Charlotte, Austin, Nashville - the returns were undeniable. New units were being absorbed before they were finished. GPs were pitching value-add multifamily deals with five-year hold projections that did little more than extend the steep upward ramp of rent growth like a flight path.
Two years later, the same submarkets were offering two months free on twelve-month leases. Lease-up timelines had doubled. Rents in several MSAs were down year-over-year for the first time in a decade. Deals underwritten in 2021 with assumed rent growth of 5% per year were left with a cash flow gap between the pro forma and reality that was rapidly consuming reserves and triggering capital calls.
The wise could see the folly of these forever upward revenues. But it doesn’t take decades of experience to see the warning signs; anyone can do it.
Let’s analyze the Fantasy Acres pro forma to see the signs that were ignored.
Pro Forma Baseline
Projected Returns

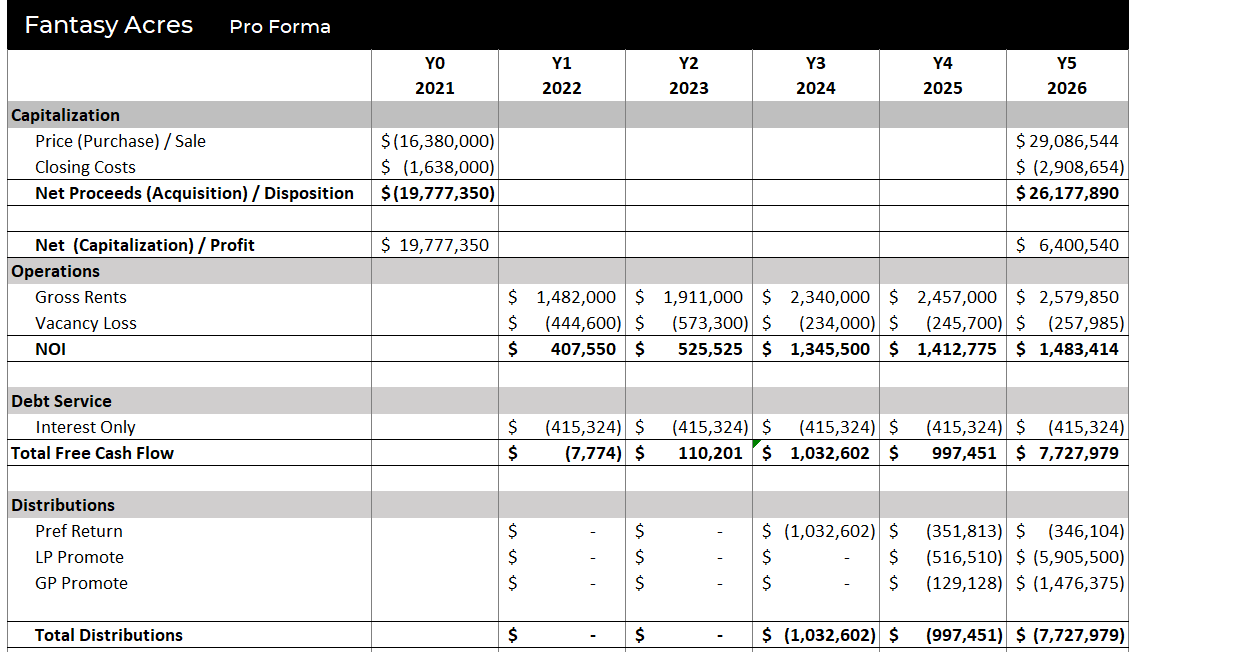
Pro Forma Rents

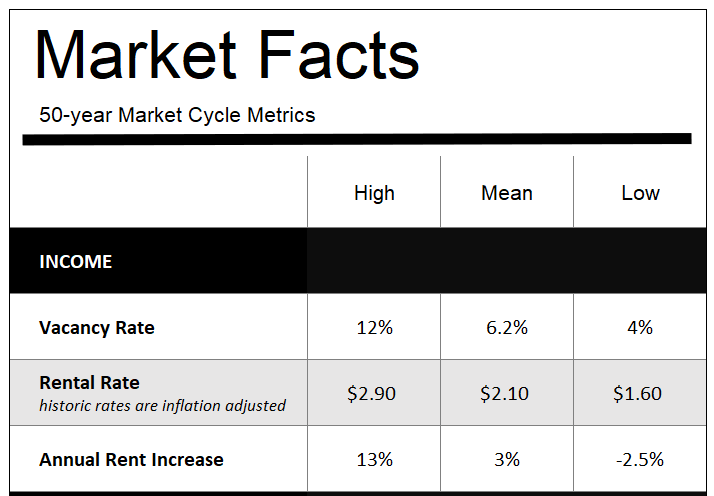
50-year Market Measures
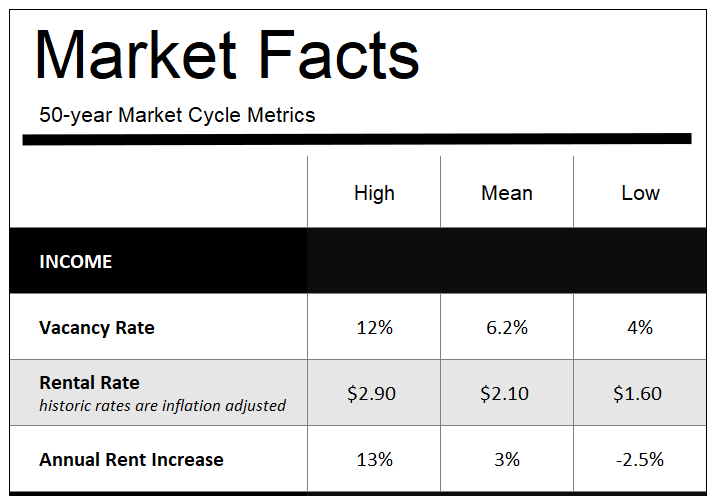
Compare the assumed rental and vacancy rates used by the pro forma to the historic data provided here. A pitch deck will rarely provide this context, but it’s vitally important to consider.
How realistic do you believe the projections are?
Testing the Assumptions
What happens if the pro forma assumptions aren’t realistic? To understand how cashflow and investor returns are impacted, we will adjust the numbers on the Fantasy Acres pro forma to see how the results change.
Rental Income
Assumption:
Renovation will provide a 60% “lift” in rental rates from $1.90 per square foot to $3.00 per square foot.
Challenge Question #1:
What is the anticipated lift based on, and how realistic is that expectation?
Future rental rates for a property that are unproven are, essentially, made-up numbers. A figment of the GP’s imagination. If a project has not already achieved at least a small number of post-renovation rents to test the hypothesized rental rates, the next best option is comps. By reviewing rents for similar projects, a reasonably accurate guess can be made for the market rental rate. The accuracy of these assumptions is contingent on:
Geography: Are the comps in the same neighborhood?
Time: Are the comps recent?
Quality: Are the comps and planned renovations and community of similar quality?
Renter economics: Are the projected rents affordable to the resident population? What demographic trends are at play and why?
Supply economics: How much new inventory is coming available, and what is the projected absorption rate?
Hopefully solid comparables are provided in the pitch deck to clearly illustrate how the rental rates were calculated. However, it’s prudent to check the provided data against industry data yourself to ensure the comps are accurate and not aspirational.
Challenge Question #2:
What happens if the renovations don’t achieve the anticipated lift?
If any one of the above-listed factors is inaccurate or changes during the life of the project, the assumed rental rate may not be the market rental rate. Since this is a 2021 deal, let’s assume the number of deliveries of new apartments was not accurately accounted for and the resulting flood of supply cut the rent lift in half to 30% ($2.45 sq ft) from the planned 60% ($3.00 sq ft).
Effect on Investor Returns
The result of a 55-cent lower rental rate is effectively 35% to 55% lower investor returns.
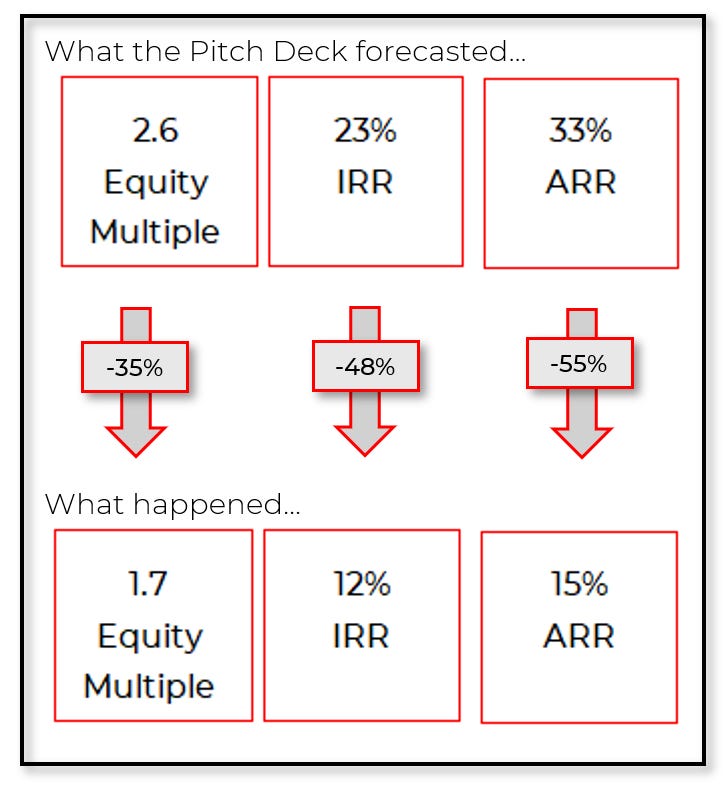
How can a 20% reduction in gross cash flow result in a 50% lower return? Let’s look at how the rental revenue flows through the pro forma.
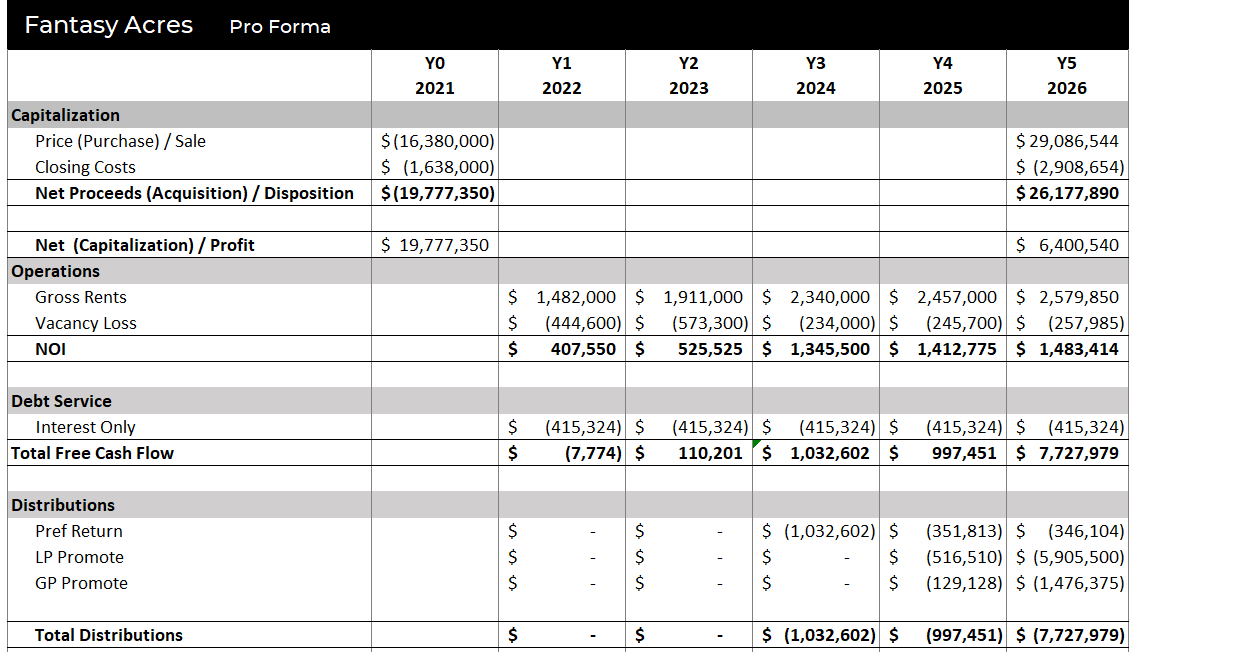
Pro Forma
Adjusted rents
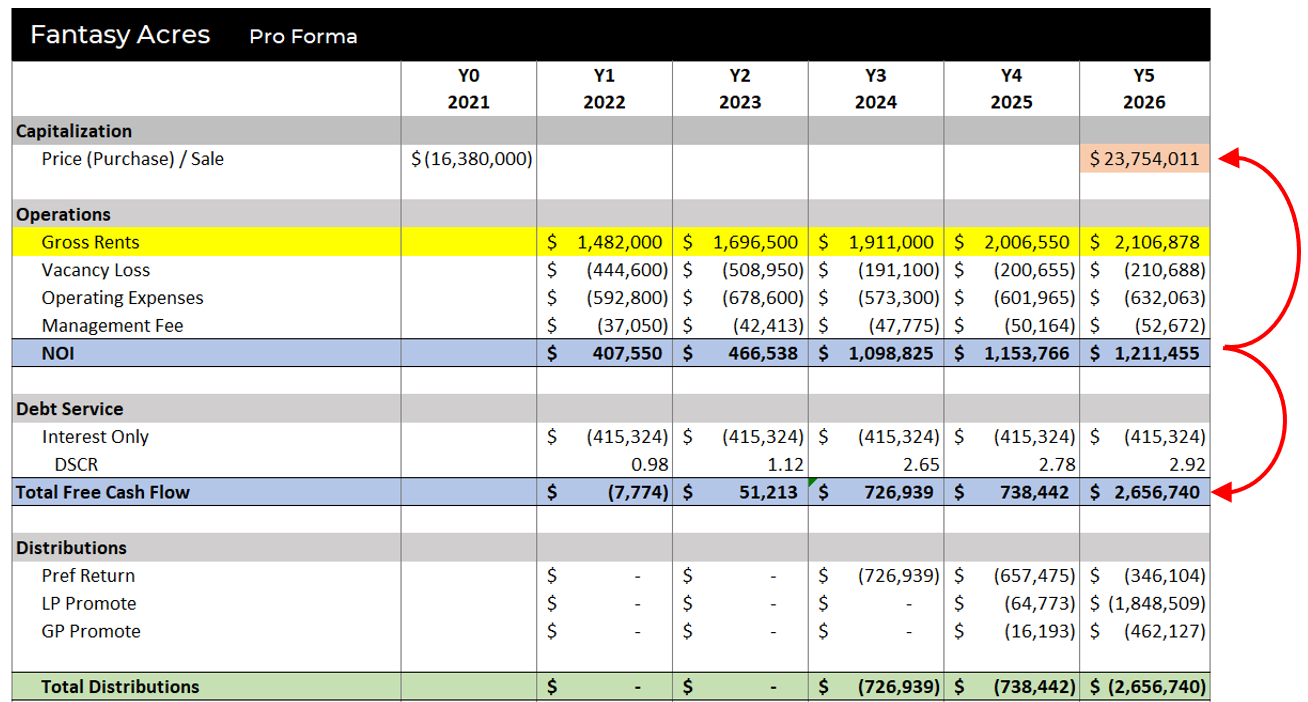
NOI is the driving number of investor results. As as result:
Distributions (shown in green) from free cash flow (NOI - debt service [shown in blue]) are depressed but sufficient to fulfill the LP pref return and the promote.
The sale price (NOI ÷ cap rate = value) is $5M (18%) less (shown in orange).
The reduction of distributions and terminal returns to investors reduced the overall cash returned to investors and the associated metrics.
You may be thinking, the returns aren’t so bad. But, lower rental rates are rarely the only factor at play. Softening market demand also increases vacancy rates.
Challenge Question #3:
What happens if market demand softens and both rental and vacancy rates are impacted?
Softening demand can result in a longer lease-up time and/or concessions (such as one month free) over the projected five-year hold. If we increase vacancy by 5 pts to 35% during the renovation period, and post-renovation to 15% (in addition to the reduced rental rates) the impacts are compounded.
Effect on Investor Returns
The combined effect of a 55-cent lower rental rate plus a 5pt higher vacancy rate is roughly half to three-quarters of investor returns wiped out, depending on the metric.
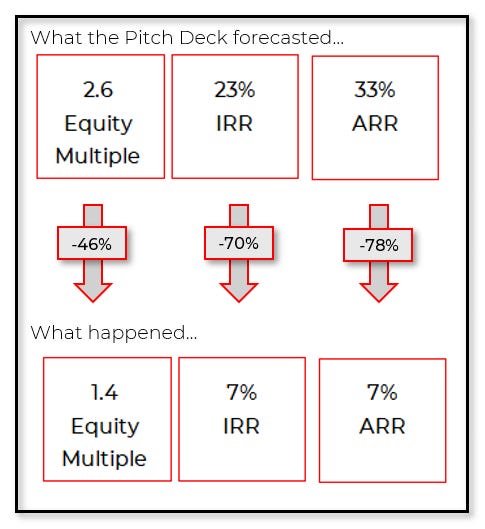
Effect on cash flow and return metrics
Pro Forma
Adjusted rent and vacancy rates
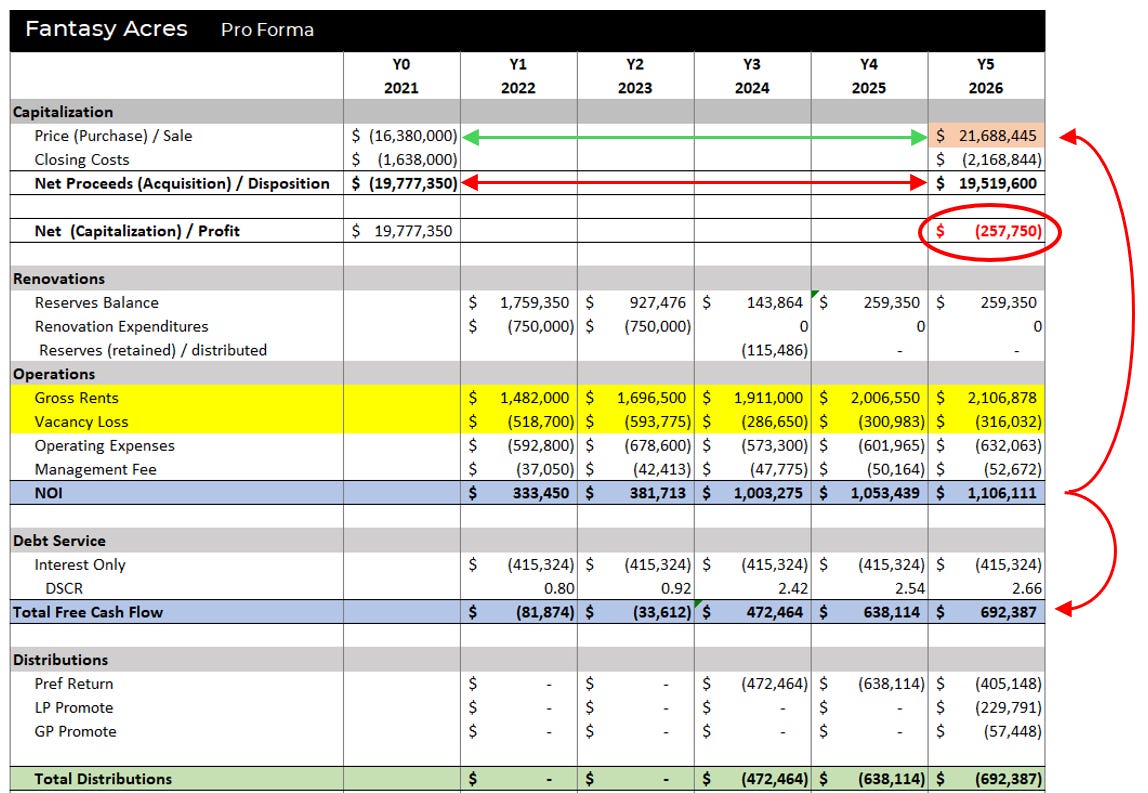
As NOI is depressed, the compounding effects become apparent:
Reduced NOI results in a much lower valuation at sale, which results in a net negative in proceeds. There are not sufficient funds to fully repay investor capital from the sale.
Cash flow remains positive in Y3 to Y5, but distributions are a fraction of expectations.
Investors were effectively returned all of their investment plus a modest return, but a small change to net income variables has destroyed most of investor returns.
Conclusion for Today
The seemingly trivial change to rental and vacancy rates had exponential impacts on investor returns. And notice what we did not change: Annual rent growth stayed at a healthy 5%. Debt remained fixed. Renovation came in on plan. And the “stressed” rental rate of $2.45 still sits above the 50-year mean of $2.10.
Recall the market history:
What happens when two assumptions break at once? When three do? When the cycle turns and they all break together?
That is the rest of this series. Because rents don't always go up – no matter what the pitch deck says.
Next in the Series
The next posts will continue to test variables in a vacuum until it all comes together as a market correction at the end. Once the mechanics are understood, I’ll show you how AI can expedite the process.
Expenses: debt and operating costs
Exit: cap rates and hold time
Market Correction: when everything goes wrong
AI Assist: how to use AI for stress testing