
HEURISTICS: Costs are Predictable
This is No. 3 of the six-part real estate pro forma series.

This is Heuristics - where assumptions are called out and broken down so that you can invest with greater clarity.
The past three years have been a multi-year, multi-front stress test of assumptions for commercial real estate. This series will cover some of the most common failure points where flawed assumptions and seemingly small numerical changes can make a good deal go bad.
This is No. 3 in the six-part Pro Forma series.
No. 1 presented the pro forma and market metrics.
No. 2 stress tested income: rent and vacancy rates.
This post covers how costs affect investor returns - specifically debt and operating expenses. In 2022 interest rates nearly tripled, moving from a historical low of about 3% to a more historically typical 8%. At the same time, operating expenses increased by 20% to 30% as a result of rising insurance premiums, rapidly increasing material and labor costs, and - in some places such as Texas - substantial changes to property tax policy. The combination of these two factors had a huge and unavoidable impact on profitability and has wiped out not only investor capital but also driven many deals into foreclosure. Let’s break down how this happened.
Pro Forma Baseline
The projected returns, expense sections of the pro forma and market data for the fictional project, Fantasy Acres, are shown below.
Projected Returns

Pro Forma Expenses
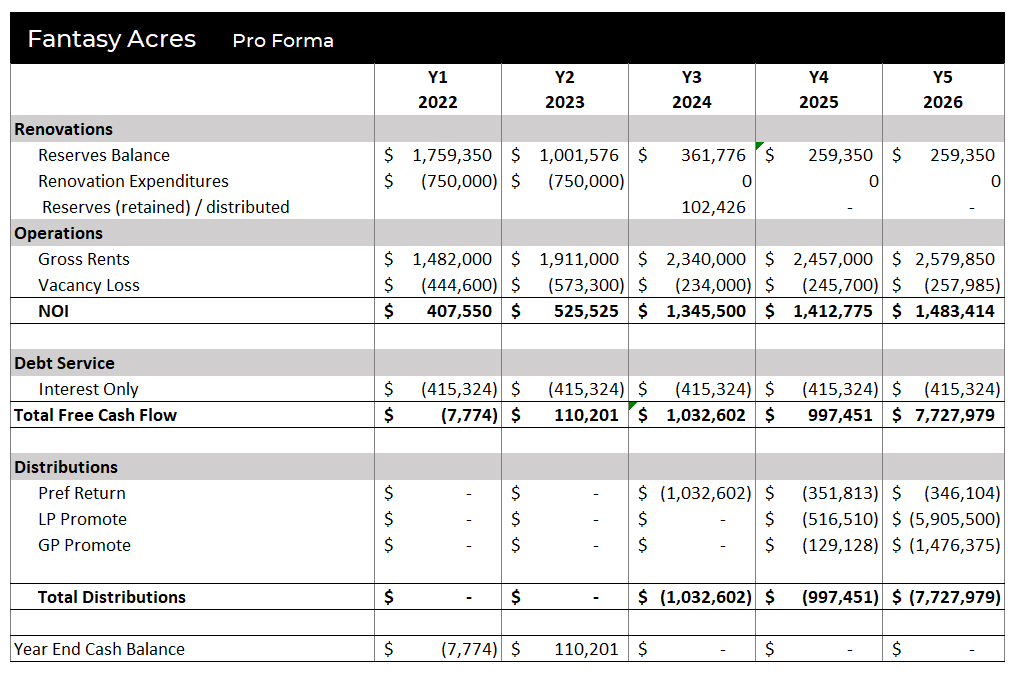
Notice that the DSCR is below 1.0 and cashflow is negative in Y1. This is due to renovation expenditures and vacancy loss, so this dip in cashflow is a normal part of a value-add project.
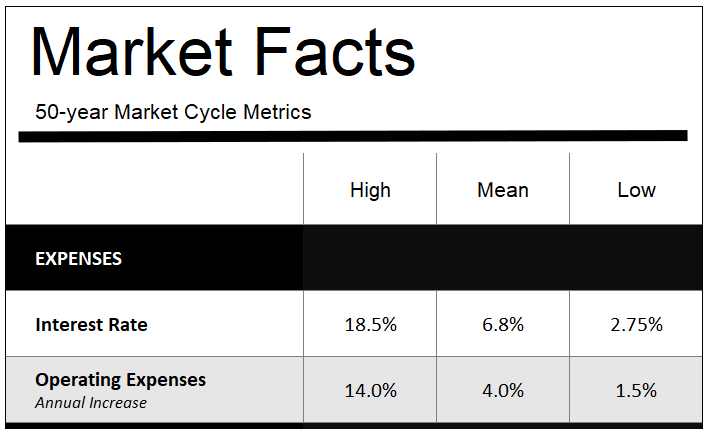
50-year Market Measures
Testing the Assumptions
What happens if the pro forma assumptions aren’t realistic? To understand how cashflow and investor returns are impacted, we will adjust the numbers on the Fantasy Acres pro forma to see how the results change.
Interest Rate
Assumption:
Debt will remain at the assumed 3% interest-only rate throughout the life of the project.
Challenge Question #1:
What are the terms of the debt and how well can the project meet those terms throughout its lifetime?
The assumed debt terms are typical of a 2021-vintage deal:
Floating rate; currently at 3%
Interest-only for the initial term
Five-year term with option for two one-year extensions
Requires maintaining at least a 1.2x DSCR and no more than a 70% LTV
As projected, the project has a 70% LTC (not LTV on acquisition cost), and a skinny 0.98x DSCR in Y1 that is covered by the reserves. However, after Y2 and renovations are complete, the boosted NOI brings the DSCR to 3.57x by Y5. There is seemingly little threat from the floating rate debt.
However, recall that the floating rate debt is assumed to remain at 3% over the five-year hold time - although this rate is at the extreme low of the historic rate range. What if rates revert to the mean and increase?
In 2022 interest rates started to rise rapidly. By Y3 of our hypothetical deal, the floating rate interest had risen from the assumed 3% to 8%, which increased the debt burden by 2.7x. By Y3, reserves are tapped, and additional capital of $520,000 is added to the deal. Let’s assume the GP funds the cashflow gap themselves without altering the capital stack.
Note that the addition of capital can have dramatic effects on common equity investors. Depending on the subscription documents, the GP may have broad discretion to insert additional cash (and layers) into the deal.
Effect on Investor Returns
Although the debt burden nearly tripled, investor returns took a relatively modest hit of between 15% and 31%. But that’s just part of the story…
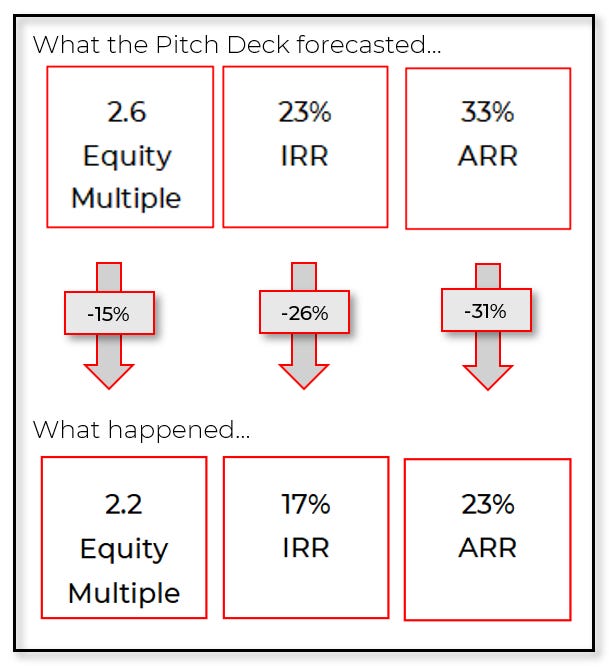
Effect on cashflow and return metrics
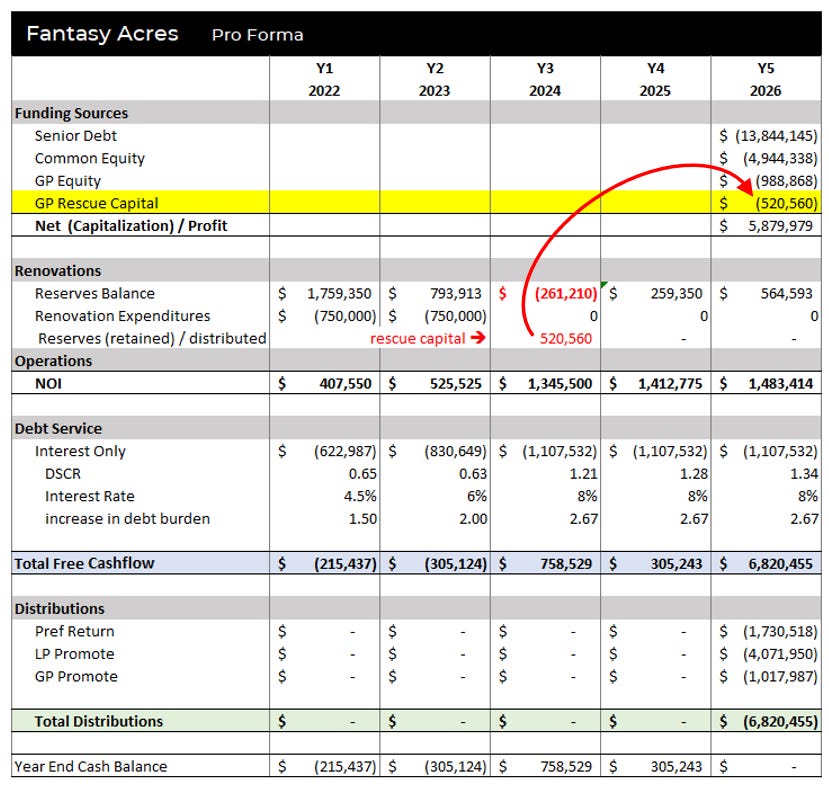
An abbreviated version of the pro forma is provided here to illuminate how the increased debt burden flows through all of the resulting calculations.
Note:
Debt payments rise far beyond the pro forma, ultimately growing by 2.7x.
Total free cashflow (shown in blue) goes negative quickly and consumes all reserves by the end of Y2.
An infusion of rescue capital in Y3 is required to restore reserves and ensure the project has sufficient cash to achieve stabilization - and positive cashflow - in Y4. But the rescue capital is not a donation - this is an additional layer of capital repayment obligations, as shown in yellow. However, due to the generous nature of the GP, this is added to their equity position with no preferred return accruing on it. A possible but unlikely scenario; rescue capital typically demands steep preferred rates of return.
Distributions (shown in green) were suspended until disposition.
The DSCR falls to half of the lender requirement in Y1 and Y2. A lender could call a loan at this point, but let’s assume the GP has a strong working relationship with the lender and convinces the bank to hold off based on the value-add performing to plan and a positive NOI being an imminent reality.
At this point, you may be wondering why rising interest rates are killing deals when this example shows only a small bump in the road. Well, debt has a shadow named cap rates who we’re ignoring for now, but the compounded effect of rising interest and cap rates will be illustrated in the market correction post towards the end of this series.
Challenge Question #2:
What if operating expenses increase?
The pro forma assumed average operating expenses of about 40% of revenues during the renovation period and a stabilized expense rate of 30% post-renovation. These are reflective of industry norms, but 2022 and 2023 saw material, labor, and insurance costs rise rapidly - effectively increasing operating expenses by about 30%.
If we factor in this 30% increase and raise the cost of operations to 52% during and 39% post-renovations, the cashflow is immediately impacted.
Effect on Investor Returns
The increased expenses coupled with the ballooning debt burden dropped investor returns by nearly 50-80% - nearly two-and-a-half to three times the impact of the increased debt burden alone.
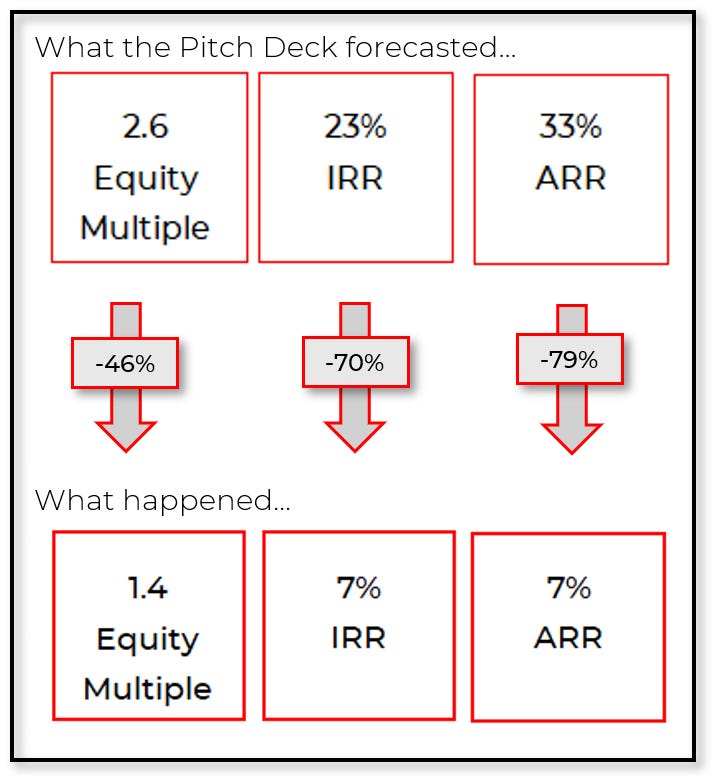
Does it seem strange that a relatively small increase of 30% in expenses had a large effect on investor returns, yet the 2.7x increase in debt only decreased investor returns by 15% to 31%? Let’s look at the pro forma to see how this happened…
Effect on cashflow and return metrics
Here is the abbreviated pro forma with operating expenses modified.
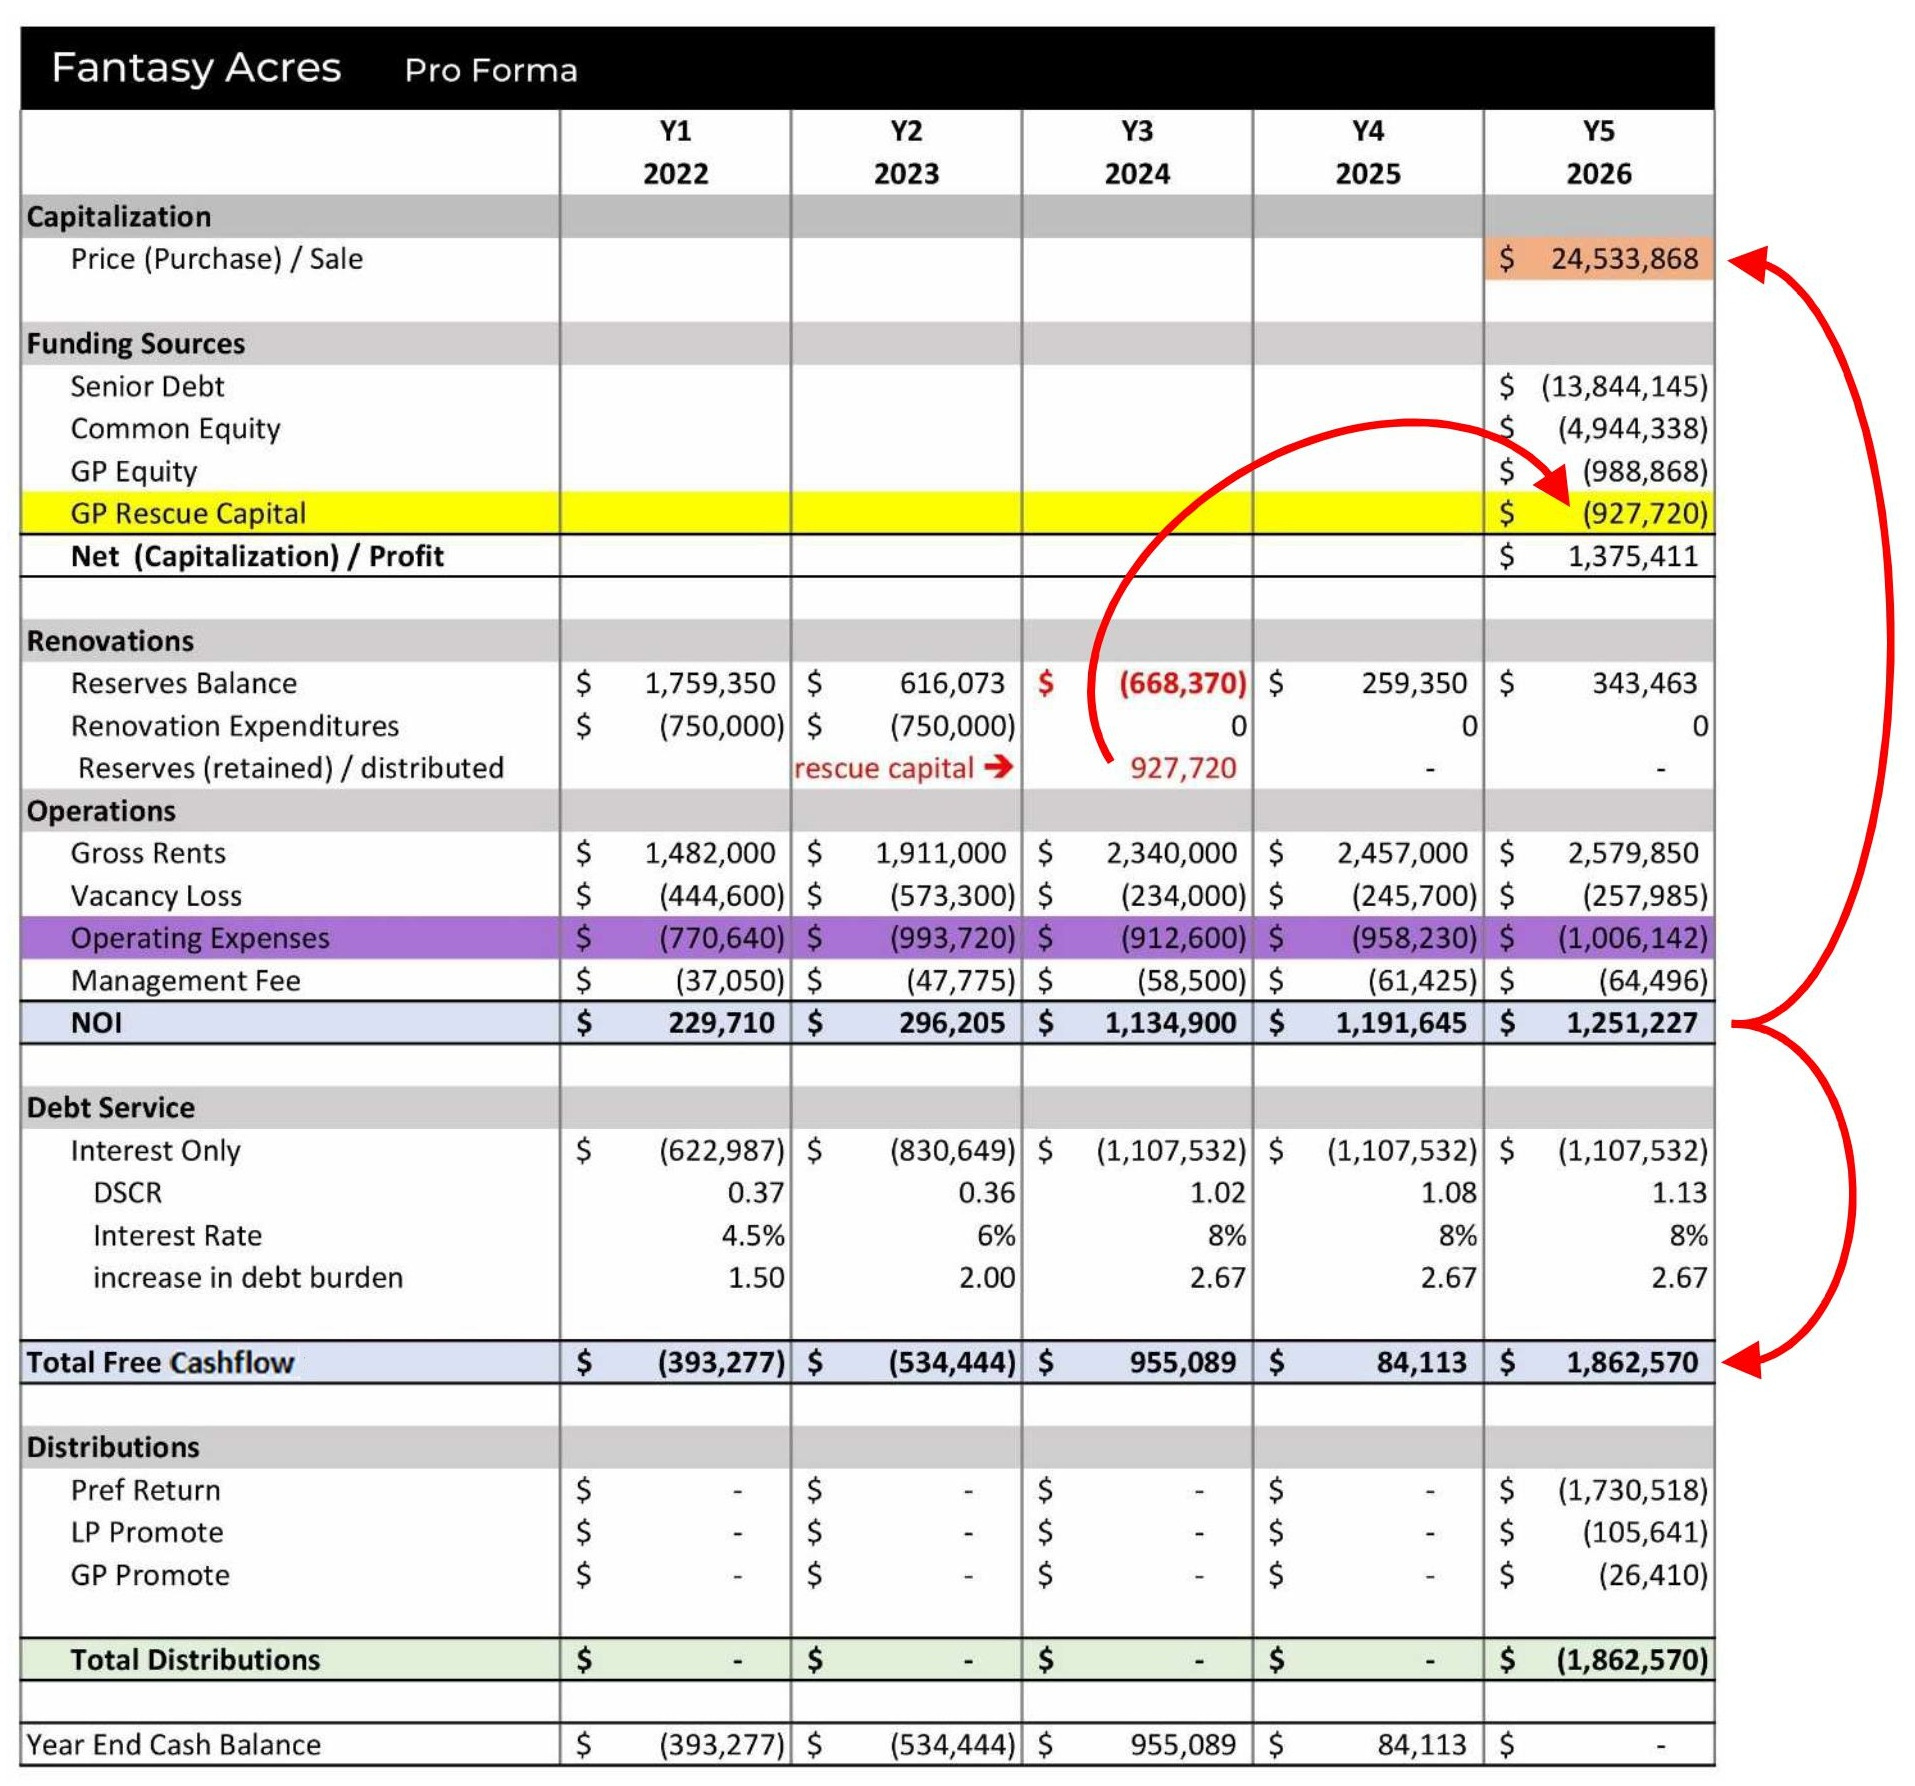
Note:
Operating expenses (shown in purple) are 30% higher than the pro forma.
Free cashflow (shown in blue) goes negative in Y1 before recovering in Y4, reserves are depleted before the end of Y2, and an infusion of nearly $1M of rescue capital is required in Y3.
Distributions (shown in green) are not made as planned in Y1-Y4, but the sale still yields enough to fulfill the accrued preferred return due to equity investors plus a small promote. Let’s assume that again, the GP is very generous and self-funds the additional capital needed in Y3 as an addition to their equity position - a highly unlikely reality since the addition of $1M in capital placed as equity with the reward of a small promote is not a compelling financial arrangement for the GP. A more likely rescue capital scenario could be the addition of mezzanine debt or pref equity, which would have added an expensive layer to the capital stack that could erode some to all of the profits before reaching common equity.
The DSCR is below the required minimum of 1.2x for the life of the project. Again, we are assuming that the GP has a very generous banker that is willing to “extend and pretend” indefinitely. In a more likely scenario, the lender could require buying down the principal in order to meet loan performance standards. This would require yet more rescue capital, which - as illustrated above - could further compromise equity investors’ capital returns.
Sale price (shown in orange) is $4.5M (16%) less than projected. Sale price = NOI x cap rate; a reduced NOI automatically translates into a lower value. As the sole source of investor returns, the reduced sale value coupled with the absence of interim payments had severe impacts on the investment’s performance metrics.
Conclusion for Today
Not all metrics have the same effect on cashflow and investor returns. Although both operating income and debt burden reduced investor returns, the impact of operating income had the greater effect since depressed NOI flows directly into the exit valuation. Debt is not part of valuation, so the impact of debt is strictly on the cashflow without flowing through to the exit value.
So far, Fantasy Acres has been able to return all invested capital plus a modest return. However, this example has made some meaningful allowances in favor of equity investors: rescue capital was provided as GP equity without expensive interest or preferred returns, and debt buy-down to meet DSCR requirements was avoided. Both are possible, but unlikely outcomes. Had either or both of these scenarios occurred, common equity investors may have recognized capital losses.
Also, look at the risk premium: is a 7% IRR reflective of the risk position of common equity? It’s easy to look at a projected return of 23% IRR and accept that as fair compensation for risk. But that 23% is only attainable should everything go right. Understanding how and where risk occurs and erodes returns puts the 23% in the correct context for better understanding risk.
The next posts will continue to test variables in a vacuum until it all comes together as a market correction at the end. Once the mechanics are understood, I’ll show you how AI can expedite the process.
Exit: cap rates and hold time
Market Correction: when everything goes wrong
AI Assist: how to use AI for stress testing