
HEURISTICS: Market Corrections are Passé
This is No. 5 of the six-part real estate pro forma series.

This is Heuristics - where assumptions are called out and broken down so that you can decide with greater clarity.
The past three years have been a multi-year, multi-front stress test of assumptions for commercial real estate. This series will cover some of the most common failure points where flawed assumptions and seemingly small numerical changes can make a good deal go bad.
This is No. 5 in the six-part series.
No. 1 presented the pro forma and market metrics.
No. 2 stress tested income: rent and vacancy rates.
No. 3 stress tested costs: debt and operating costs.
No. 4 stress tested disposition metrics: cap rates and hold time.
This post will stress test a market correction: when interest and cap rates increase, and when supply outpaces demand.
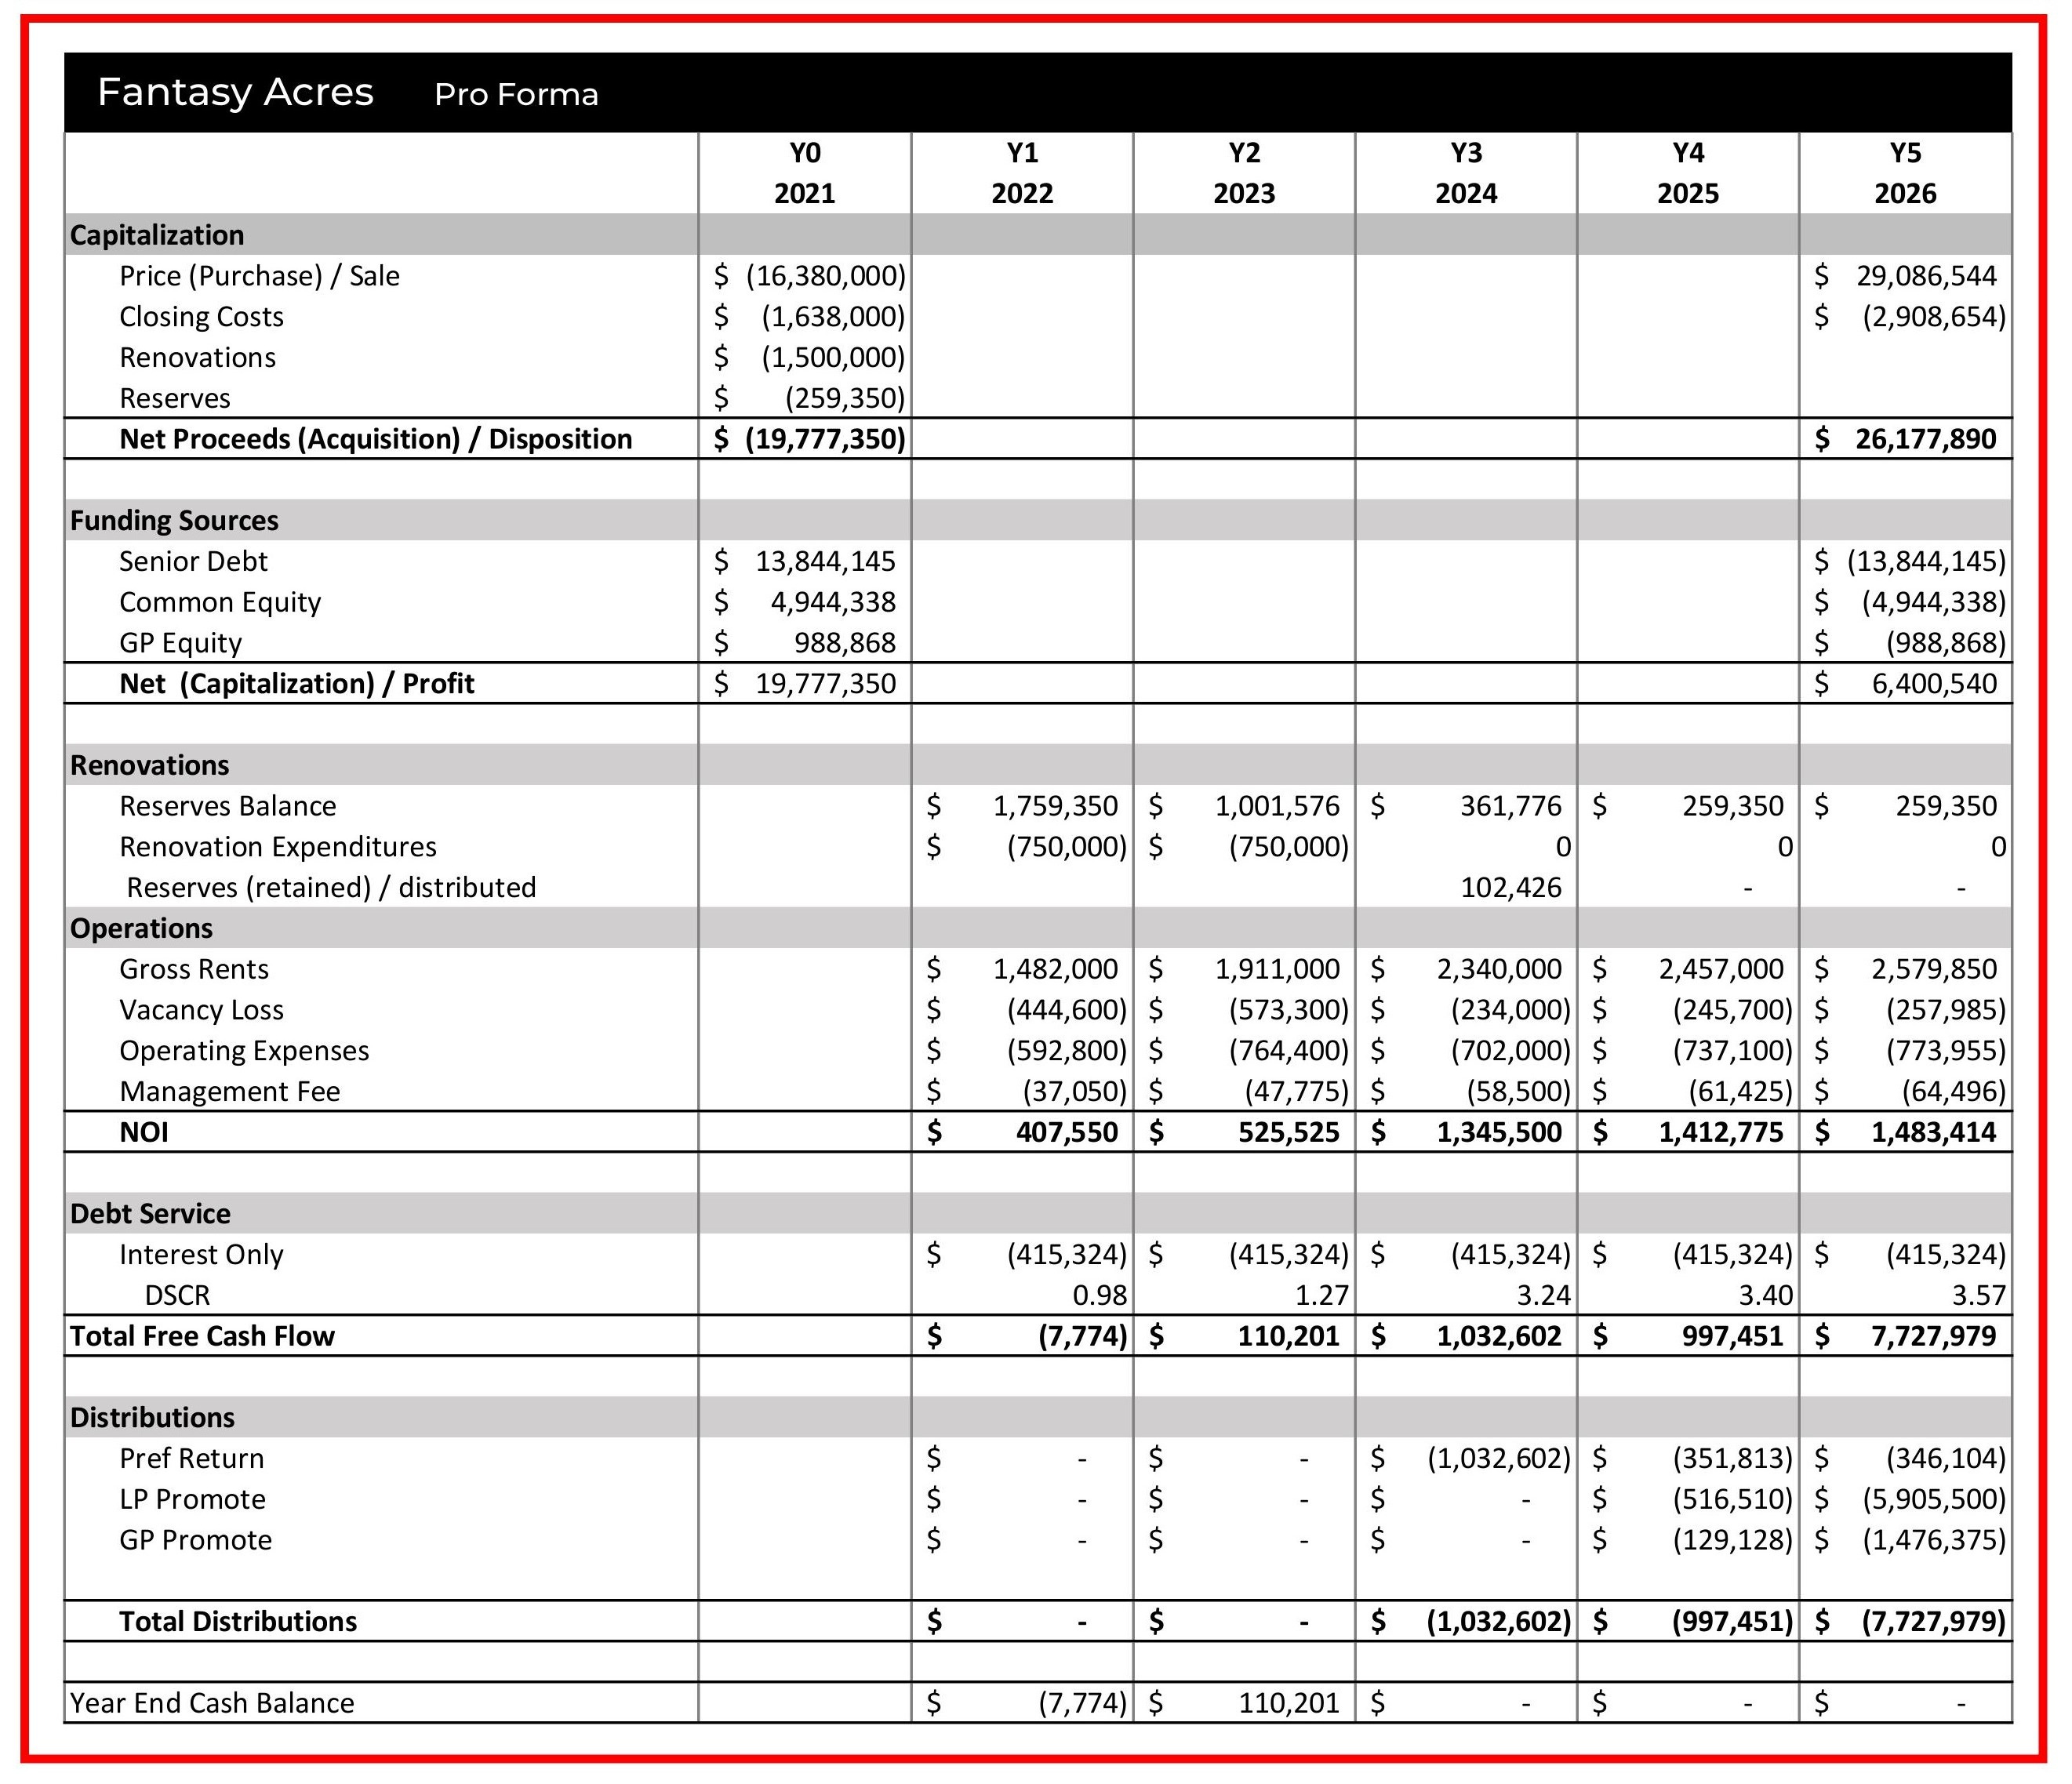
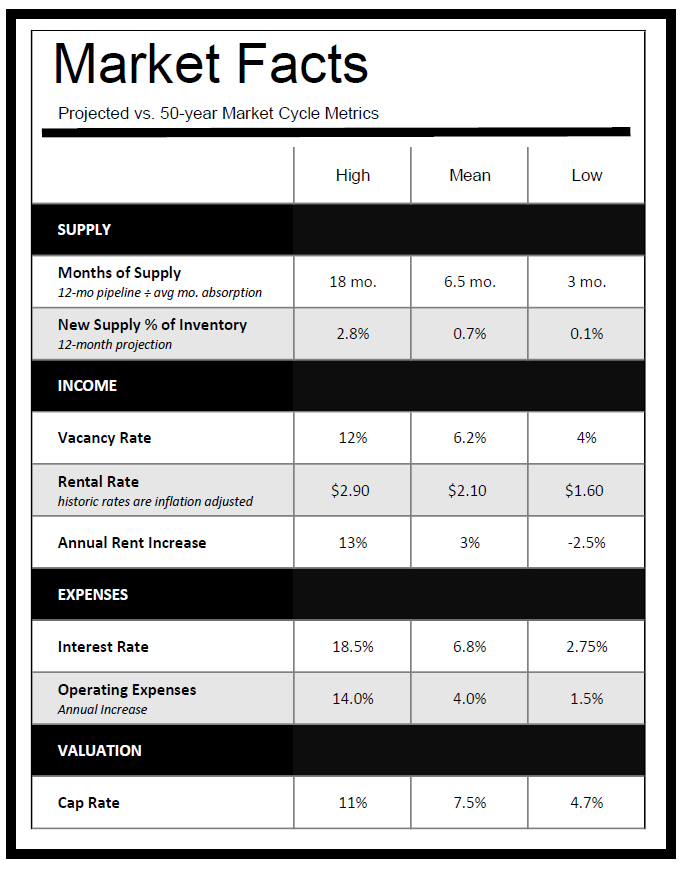
Before then, let’s revisit the rosy future predicted by the pro forma for the fictional project, Fantasy Acres - a value-add multifamily project with a five-year hold, and the historical market data shown below.
Projected Returns

Pro Forma
50-year Market Measures
Testing the Assumptions
Interest and Cap Rates
In 2021, commercial real estate had been borrowing at less than 4% for the better part of 13 years - a period that was unusual not only for its length and stability, but for holding, without precedent, at the historic low.
In 2022, the run ended when the Fed raised rates steadily for 16 months from near zero percent to 5.5% - a pattern more aligned with norms than anomalies.
Back at Fantasy Acres, the GP and LPs were in shock - they had never seen anything like this - having built their business models on the previous ten years’ liberal lending terms with predictably low interest and cap rates - which produced high purchase values and all but guaranteed equivalently high sale prices. Anything more than a half a percentage point deviation was not considered possible. Reversion to the mean relegated to economic theory, not market reality. This was the 2020s, not the 1980s.
But, revert it did.
The effects of interest rates on Fantasy Acres are covered in no. 3 of this series, which demonstrated how an interest rate increase from 3% to 8% consumed all cash flow and reserves by the end of Y2 that necessitated a capital infusion in Y3, but exited in Y5 with a below-expected IRR of 17%.
In no. 4 of this series, the increase in the cap rate from the projected 5.1% to 6% realized at disposition, reduced investor returns by 30% to a 16% IRR.
But these are mathematical experiments; the returns did not account for the reality of cap rate changes that follow interest rate changes. Here is how rate changes affect cash flow and investor returns when accounted for more accurately: in tandem.
How Interest and Cap Rate Increases Destroy Value
Since we’re using actual (not hypothetical) conditions we will retain the previously-modeled interest rate change of 3% increasing to 8%, and assume that the prevailing exit cap rate in Y5 (2026) is 6.5% (not the previously modeled 6.0%). Under these conditions, much remains the same as before:
Increasing debt load consumes cash flow and reserves by Y2.
Rescue capital is provided in Y3 by the GP (structured as a non-interest-bearing, non-dilutive loan).
Cash flow turns positive in Y3 as the value-add strategy performs to plan.
Investors receive zero distributions from free cash flow Y1-Y5; all returns are provided via sale proceeds at the exit.
When adding the expanded cap rate at exit to the equation, investor returns are reduced by 54% to 85% from pro forma projections, with the actual return coming close to the risk-free rate on a very much not risk-free investment.
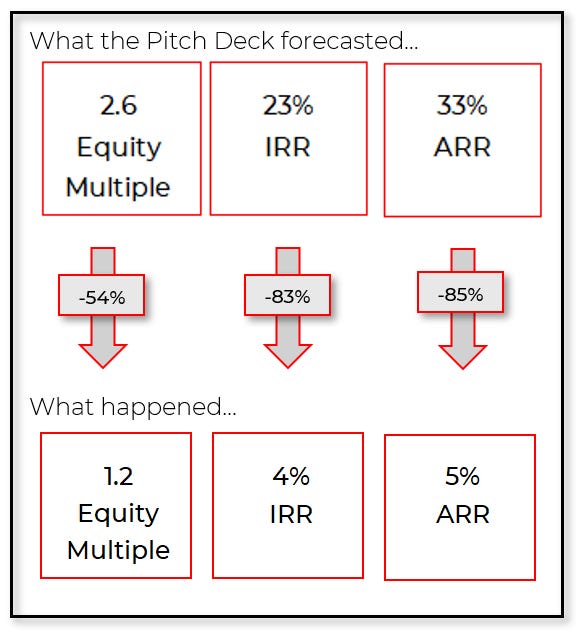
Effect on cash flow and return metrics
To understand how this happened, let’s look at the cash flow.
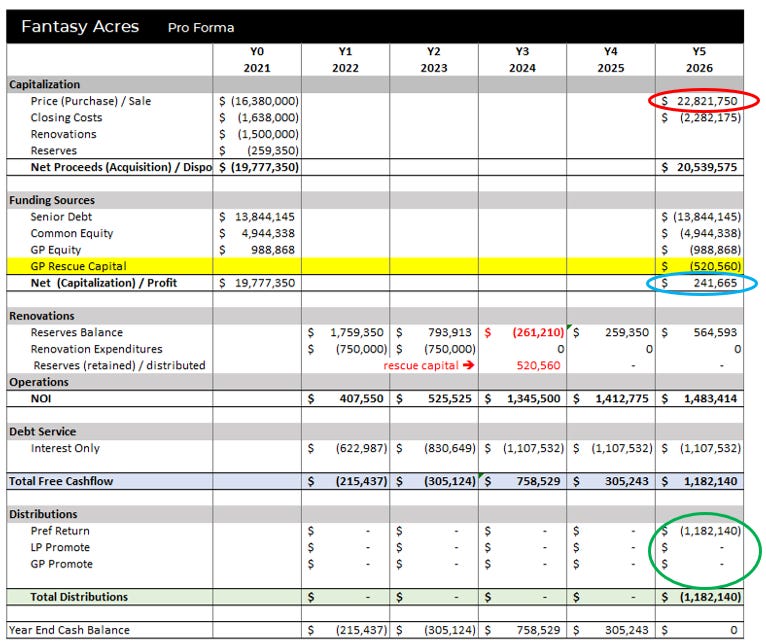
Note:
The larger cap rate reduced the sale value (within the red circle) by 22% and $6.3M from the projected $29.1M to the realized $22.8M.
The addition of the interest-free rescue capital (highlighted in yellow), saved the project from ruin in Y3, but further reduced the project’s profitability.
The project’s profits (within the blue circle) are nearly completely erased from the forecasted $6.4M to little more than $240,000.
The final distributions in Y5 (within the green circle) fulfill ~$1.2M of the $1.7M cumulative preferred equity due to LPs.
Funds never reach the second tier of the waterfall agreement - the promote split. All parties were returned their investment, but LPs received a small return on their investment, and the GP received no return.
Supply and Demand
Supply in excess of demand drove strong rental increase rates across many regions - until the tables turned and rental increases turned into decreases and concessions.
The reasons for the dramatic rise and fall of rental rates are multifaceted but the following graphic helps to put the market drama into perspective.
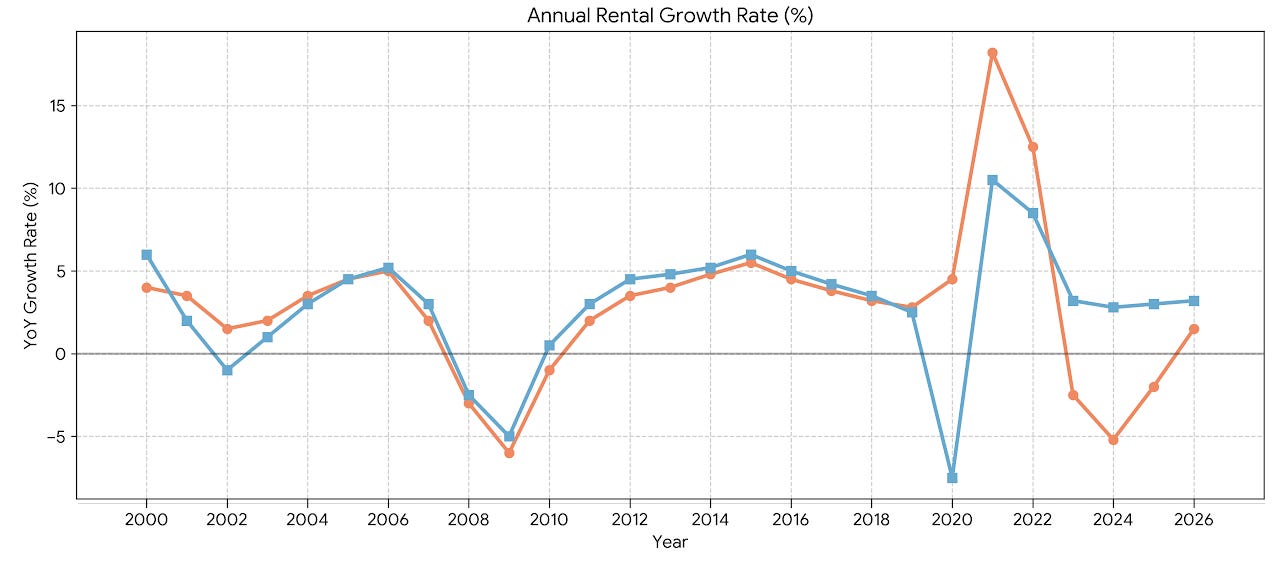
Again, the GP at Fantasy Acres was facing a reality it had never seen before: rent decreases. The pro forma assumed a steady 5% YoY increase in rents with a 10% vacancy rate - safe assumptions that worked for the previous ten years.
2021 was a dream: 3% interest rates, zero vacancy, and rents increasing in excess of 10%. But 2023 was a nightmare: 8% interest and 10% vacancy rates, rent reductions, and concessions all coalesced to dramatically erode NOI. Multiply the reduced NOI by the expanded cap rate and the exit returns quickly go into the red.
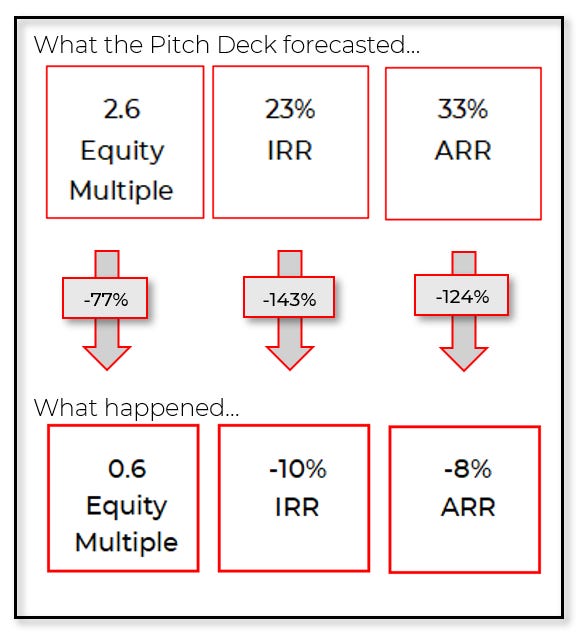
Effect on cash flow and return metrics
Let’s look at the cash flow to see what went wrong.
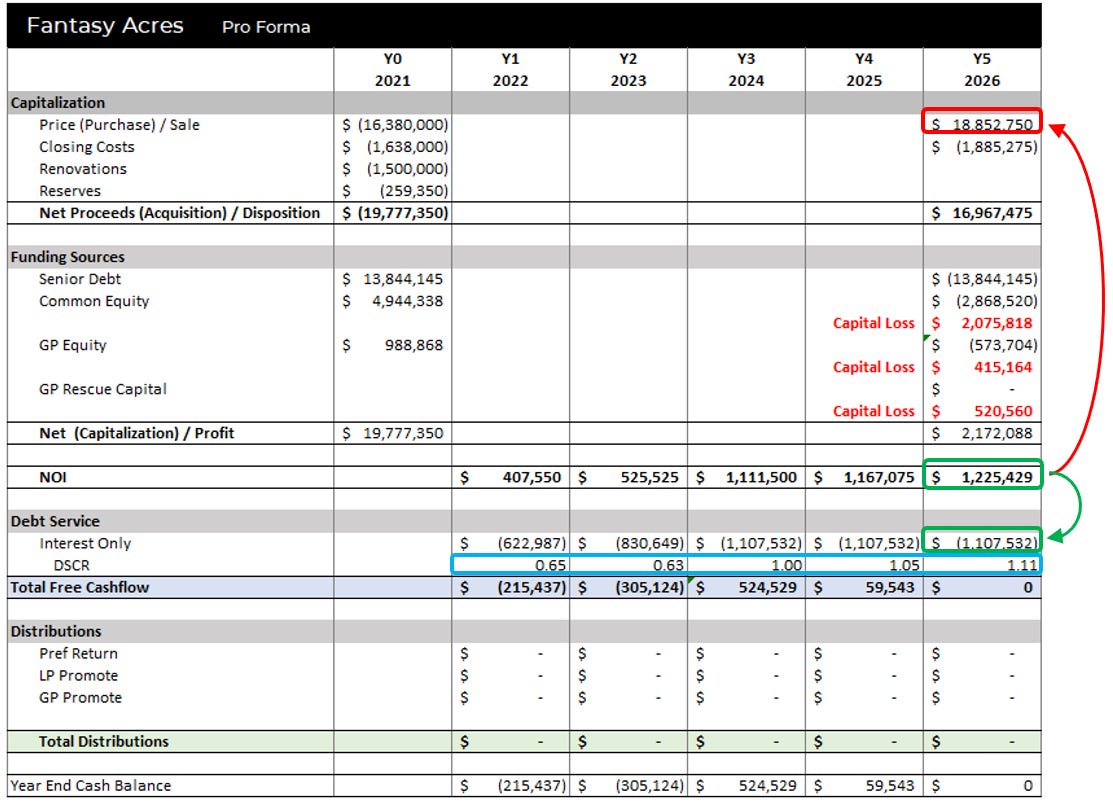
Note:
The reduced NOI (resulting from lower rents and higher vacancy) multiplied by the larger cap (driven by increased interest rates and market uncertainty), resulted in a much lower final sale price (shown in the red square).
Despite the reduced NOI, Fantasy Acres was cash flow positive by Y3 and continued as such through Y5: the value-add lifted NOI to a level sufficient to service the debt (as shown by the green boxes).
The DSCR never reached the required 1.2x. By Y5 the lender was no longer willing to extend and pretend. Like many other deals, the GP was unable to float additional rescue capital and the LPs weren’t interested in additional capital calls. As a result, the lender forced a sale in Y5 under terrible market conditions.
This is not unrealistic:
The Debrief: How a Value-Add was a Total Loss, profiled a deal lost under similar conditions.
Sale proceeds were nearly $3M less than the total capitalization - sufficient to pay off the debt principal, but LPs lost ~$2.1M of their $4.9M; the GP lost ~$0.4M of equity plus its entire $0.5M rescue loan (as shown in the red text).
A historically accurate reenactment of the full array of market stressors experienced from 2023 through 2026 was not accounted for in this example. Increasing material and labor costs, insurance premium hikes, losses to extreme weather, the high interest rate of rescue capital, and a higher cap rate typical of a forced sale were all conveniently ignored. At this point, it should be clear that the addition of any one of these items could easily wipe out all equity and potentially part of the debt principal.
Conclusion for Today
The dual market stress of higher interest and cap rates coupled with reduced rental income has vaporized millions in equity capital across the US. Add in the plethora of other challenges to profitability, and asset values go underwater and the bank starts taking losses too.
Some say “interest rates rose at an unprecedented rate to a historic high”.
Others blame “unforeseeable rental rate softening”.
But is “unprecedented”, “unforeseeable”, and “historic” an accurate depiction of a normal market correction?
Whatever the reason(s) and no matter how surprising or predictable they may be, the flaw is in the assumption that the market will remain stable and favorable. This series shows how those flawed assumptions resulted not only in distressed assets but lost capital at every layer of the capital stack.
Next in the Series
Now that the mechanics of the pro forma, its assumptions, and market variation are clear, the last post in this series will show how AI can take a pitch deck and provide two crucial pieces of information:
the risk profile (as plotted on the Risk Radar), and
sensitivity analysis (to show where the pro forma breaks).