
HEURISTICS: Real Estate Always Appreciates
This is No. 4 of the six-part real estate pro forma series.

This is Heuristics - where assumptions are called out and broken down so that you can invest with greater clarity.
The past three years have been a multi-year, multi-front stress test of assumptions for commercial real estate. This series will cover some of the most common failure points where flawed assumptions and seemingly small numerical changes can make a good deal go bad.
This is No. 4 in the six-part series.
No. 1 presented the pro forma and market metrics.
No. 2 stress tested income: rent and vacancy rates.
No. 3 stress tested costs: debt and operating costs.
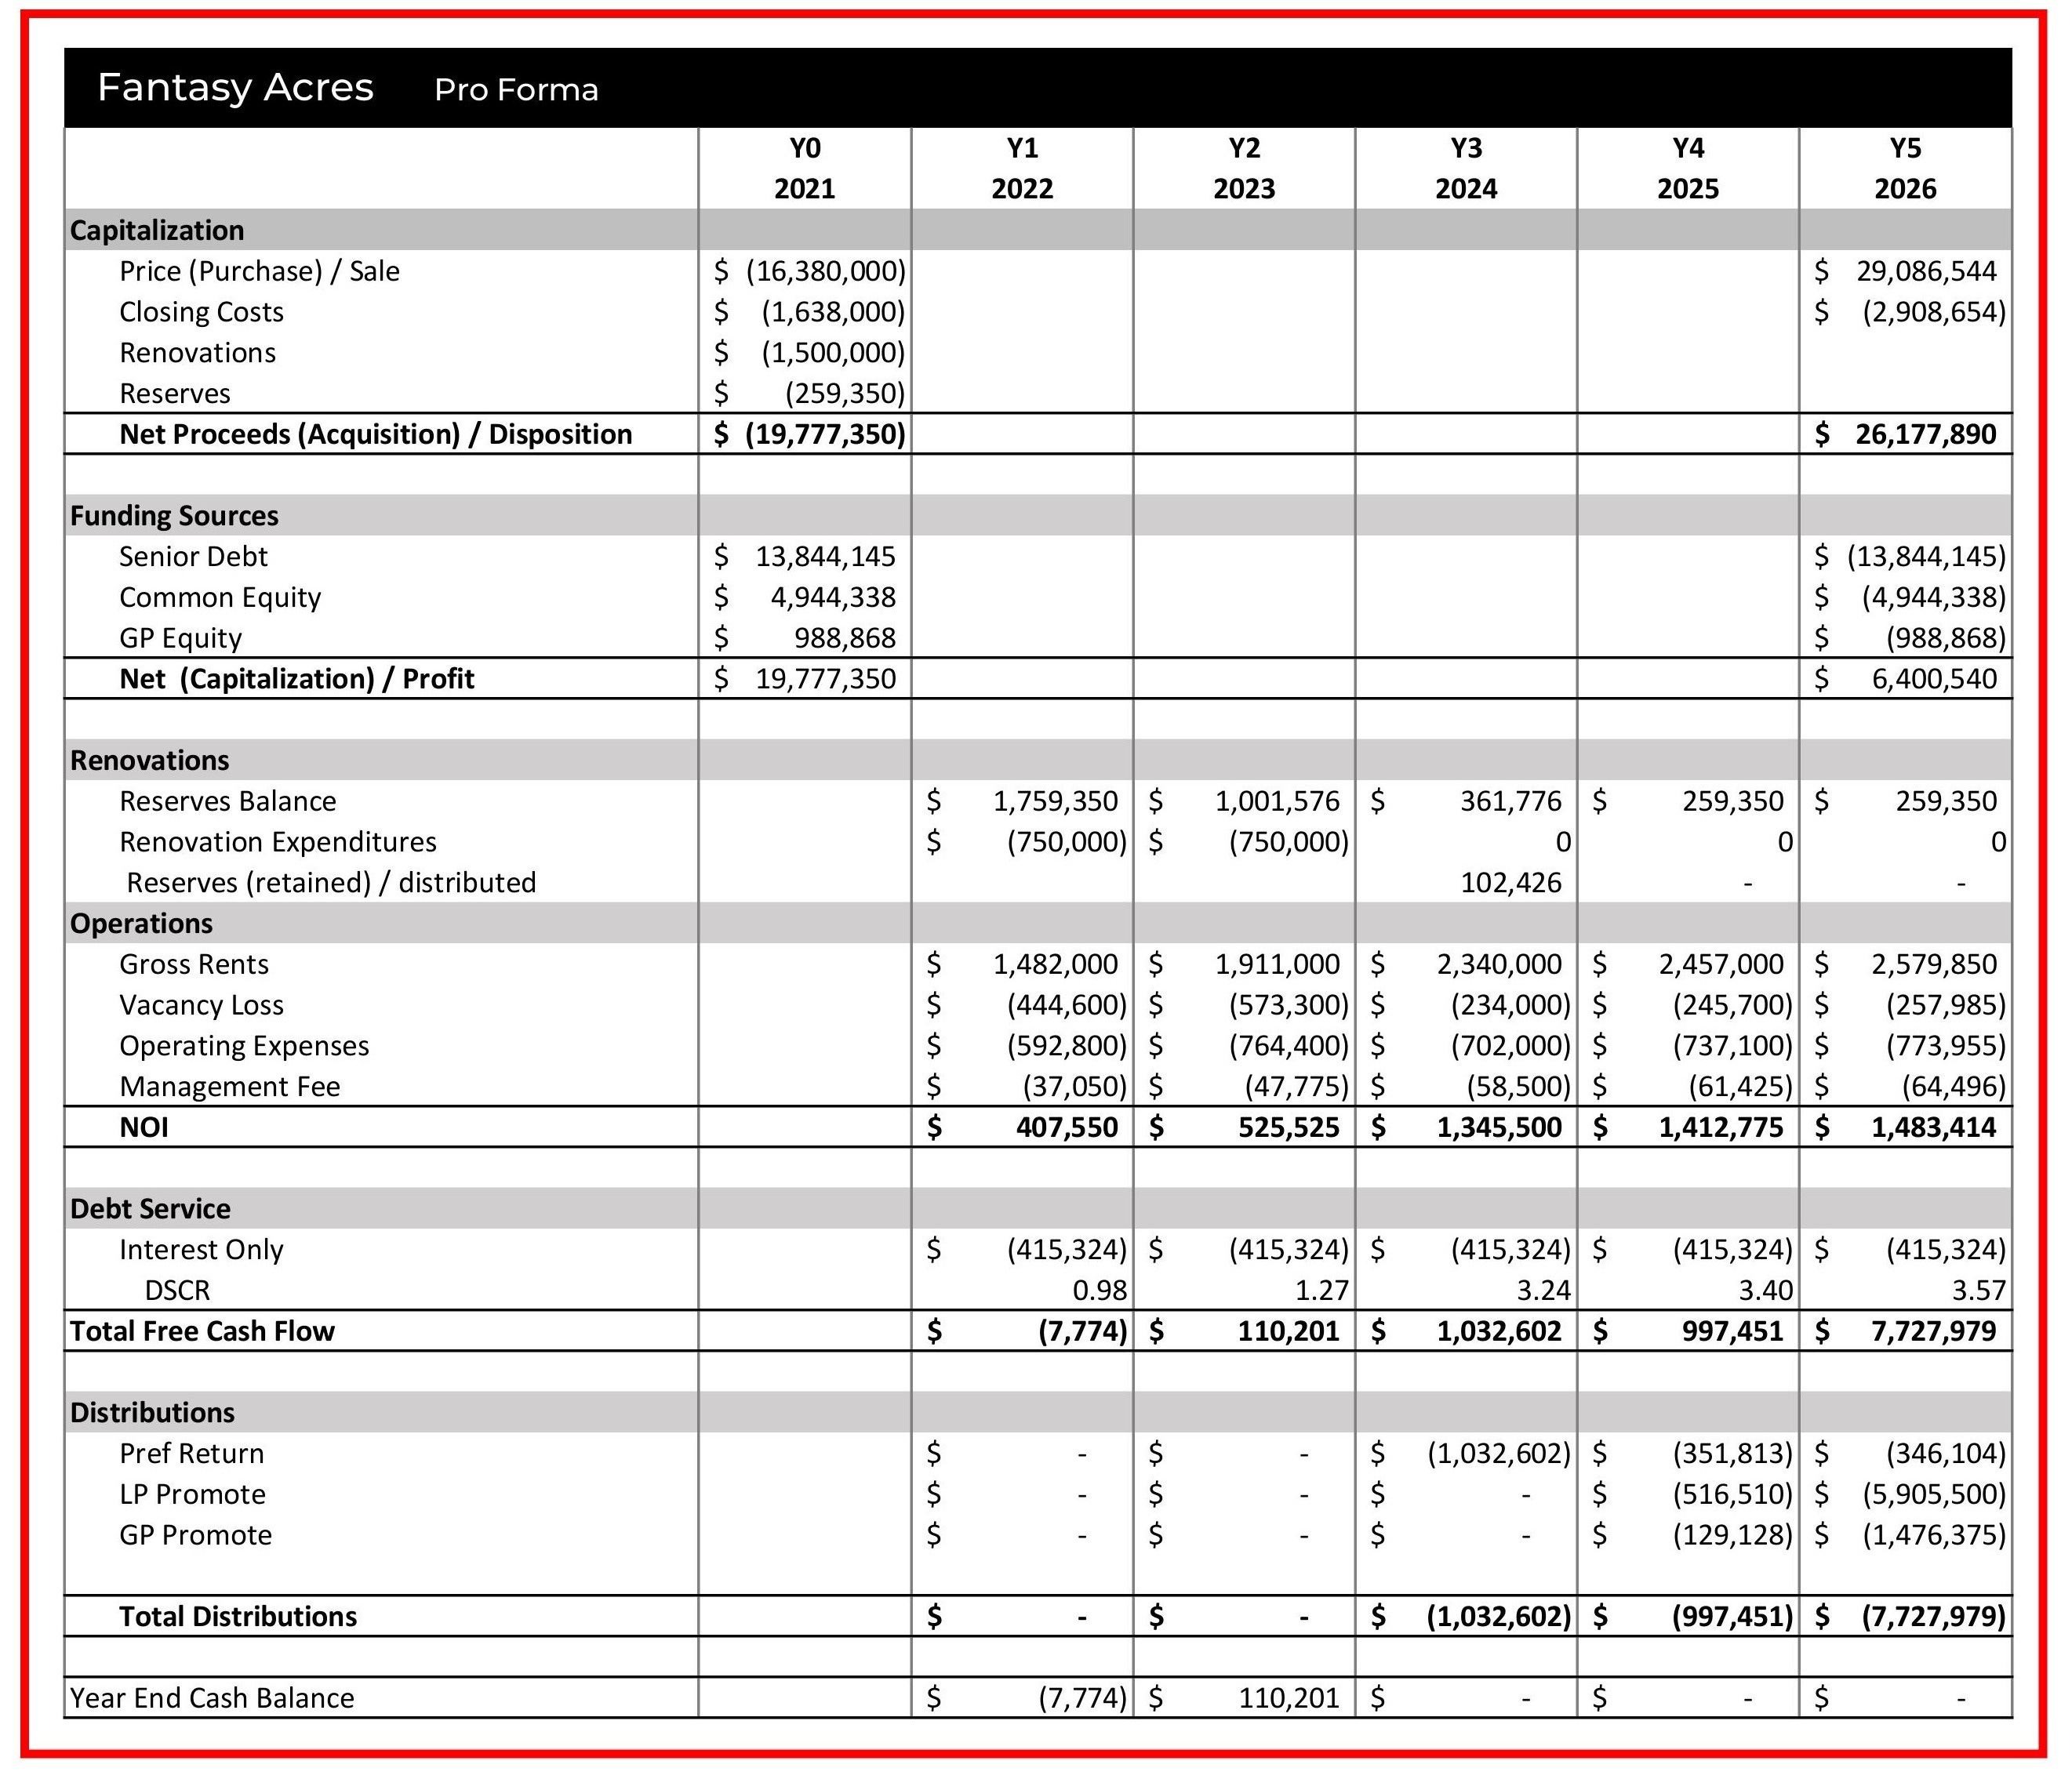
This post stress tests the disposition assumptions: cap rate and hold time. The pro forma and market data for the fictional project, Fantasy Acres, are shown below.
Projected Returns

Pro Forma
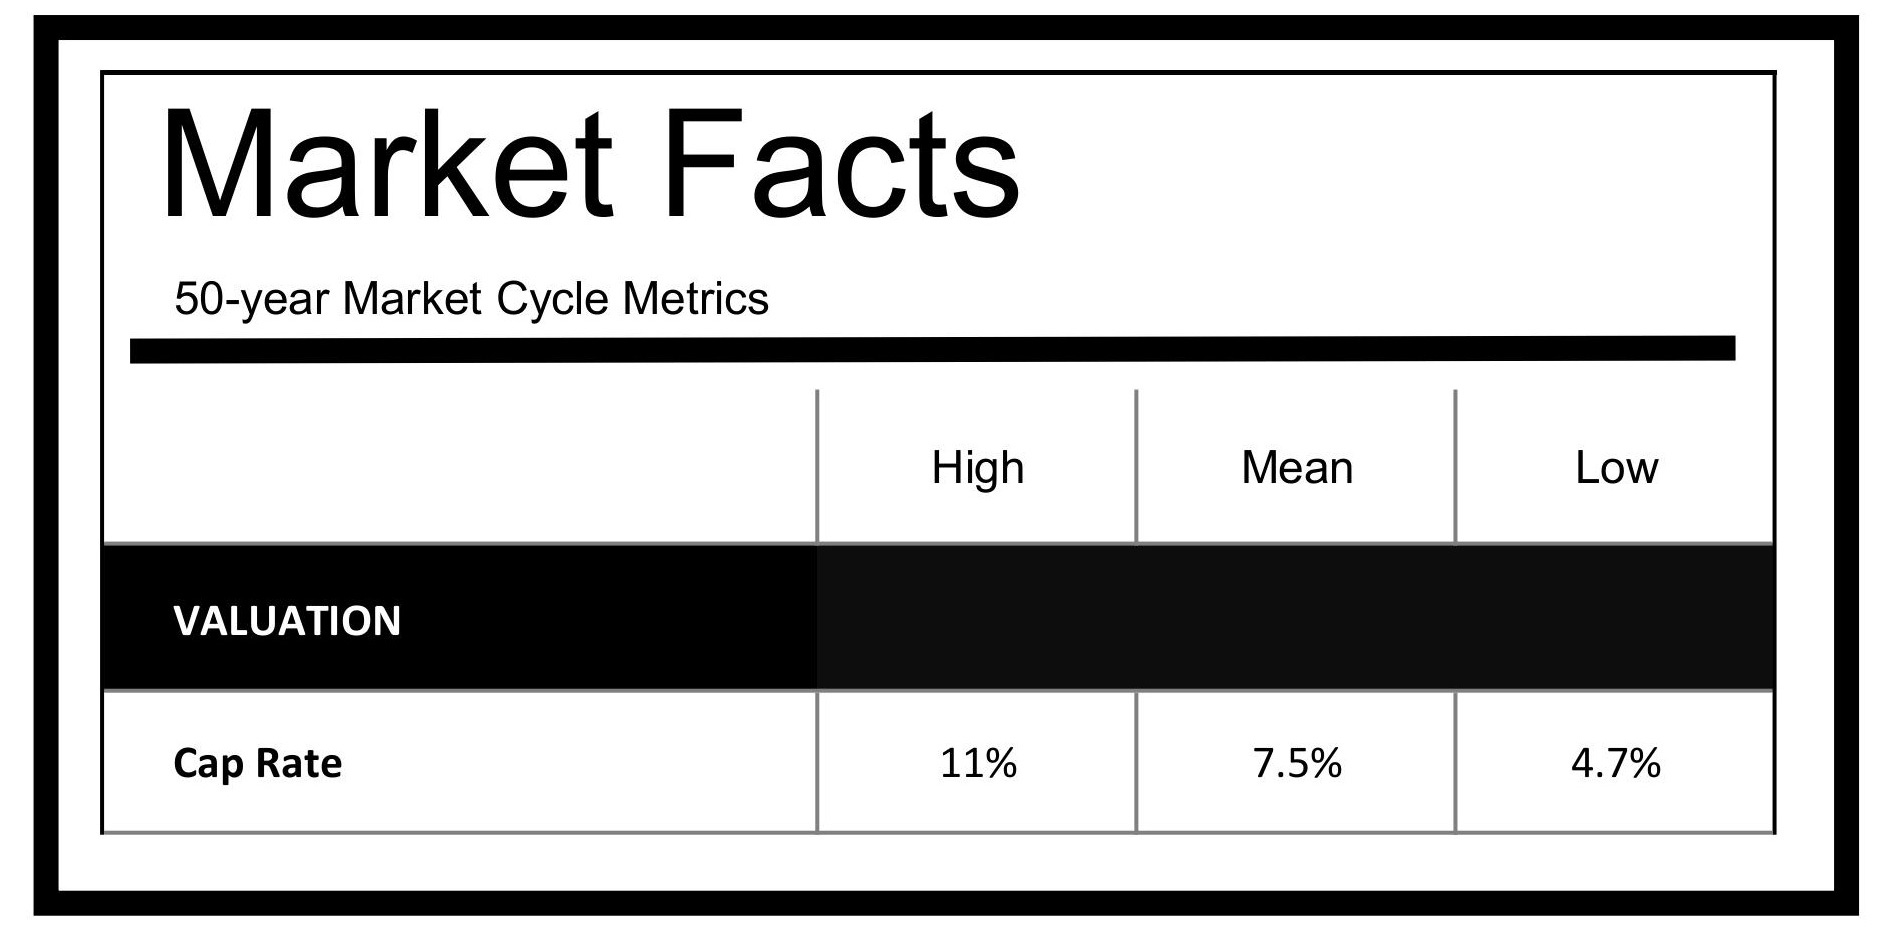
50-year Market Measures
Testing the Assumptions
Cap Rates
In the simplest of terms, the cap rate is the rate of return on an investment. But the cap rate incorporates many variables, is highly volatile, and is subject to many exceptions. Check out the Investopedia cap rates page to learn more.
For this discussion, we’ll focus on two of the mathematical mechanics that use cap rates:
Cap Rate = NOI ÷ Price
typically provided for the acquisition/purchase price
Market Value = NOI ÷ Cap Rate
typically used to calculate the disposition/sale price
Fantasy Acres Example
The Fantasy Acres pro forma is using cap rates at two important points:
Acquisition: 4.75% cap rate
4.75% cap rate = $780,000 (NOI) ÷ $16.4M (Price)
These figures are known and fixed at the time of acquisition.
Disposition: 5.1% cap rate
5.1% cap rate = $1.5M (NOI) ÷ $29.1M (assumed sale price)
These figures are estimates. The sale price is entirely dependent on the actual NOI and actual cap rate at the time of disposition.
To contextualize the previous numbers, consider the inputs and how accurately they may forecast returns:
The 50-year historical low cap rate is 4.7%; the average is 7.5%. The purchase price is at a 4.75% cap rate - a figure near the historical low edge. And, the sale price is anticipated at a 5.1% cap rate - an allowance of just 35 bps from the purchase cap rate and far closer to the historical low than the historical average.
The NOI is assumed to nearly double from $780,000 to $1.5M in five years. Is this estimate accurate?
See how NOI estimates may not line up with reality, and the effects on investor returns:
The Effects of Cap Rate Expansion
Let’s assume that the projected NOI is achieved but true to the Fantasy Acres timeline, which planned a sale in 2026, cap rates expanded in tandem with interest rates and market uncertainty and are currently at about 6.0%.
By simply adjusting the assumed exit cap rate of 5.1% by 90 bps to the current market norm of 6.0%, the exit figures change as follows:
Effect on Investor Returns
A 0.9 pt expansion of the cap rate (an increase of about 18%) reduced investor returns by 23% to 40%. A small movement resulted in an outsized impact.
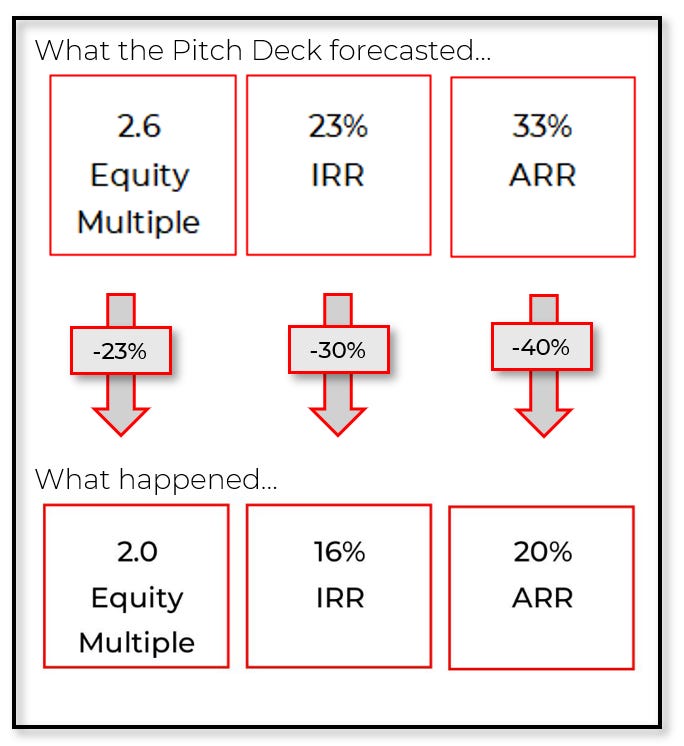
Effect on Return Metrics
Recall the math: Market Value = NOI ÷ Cap Rate. In this scenario, the assumed NOI at exit was realized but the cap rate expanded 0.9 pt / 18% to 6.0% - a variable that is subject to market forces and cannot be controlled. If NOI remains the same and is divided by a cap rate that is a larger number, the result (the sale price) will be smaller.
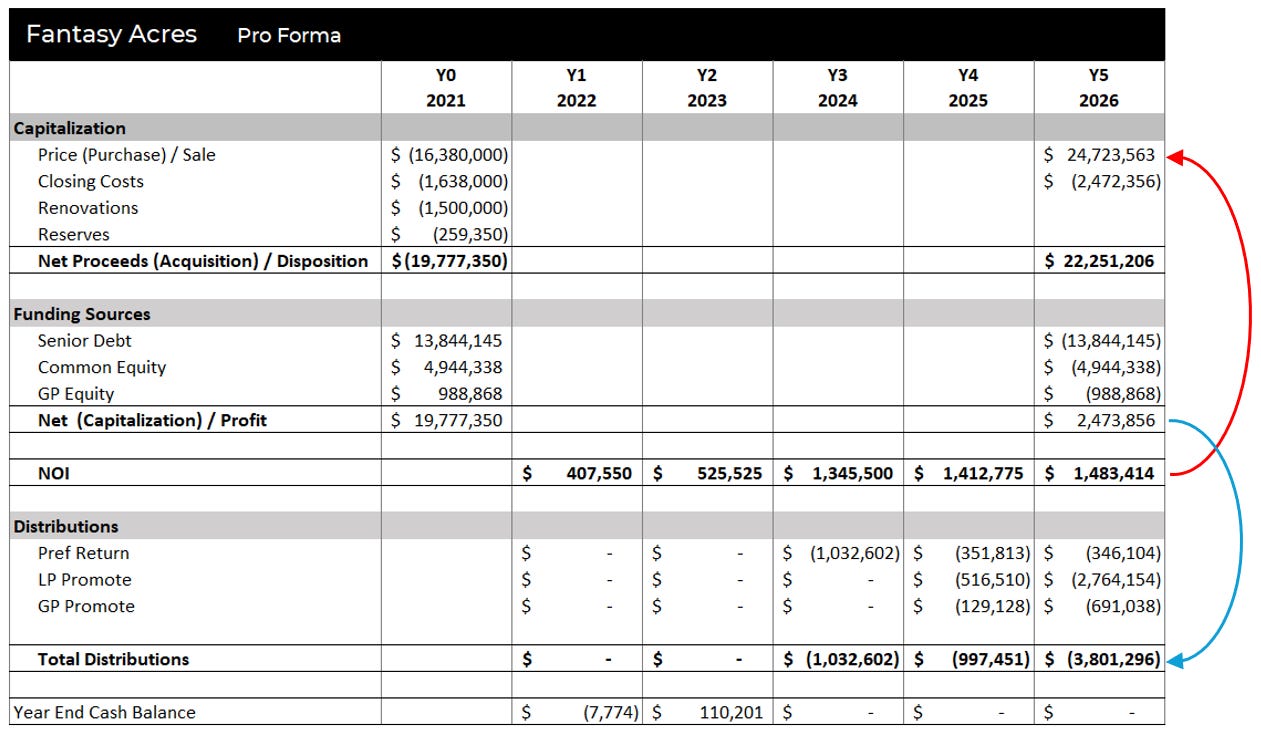
Note:
The assumed sale price was $29.1 M = $1.5M (NOI) ÷ 5.1% (cap rate), but
The realized sale price is $24.7M = $1.5M (NOI) ÷ 6.0% (cap rate).
The 0.9pt / 18% cap rate expansion reduced the exit value by $4.4M or 15% - as shown by the red arrow.
Y1-Y5 cashflow distributions were made according to plan, but the reduced exit value also reduced the profit on the sale by 61% from $6.4M to $2.5M, which then reduced:
the promote split to common equity investors by 53% from $5.9M to $2.8M, and
total return to investors by 23% to 40%- depending on the measurement method.
Hold Time
Let’s assume the GP decides to not sell in 2026 and wait for better market conditions - and all other variables stay the same: the debt terms, NOI, growth rates, etc. But the hoped-for reduced cap rate market conditions aren’t forthcoming. After 24 months of waiting, the GP decides to sell in 2028 at the same 6.0% cap rate.
Effect on Investor Returns
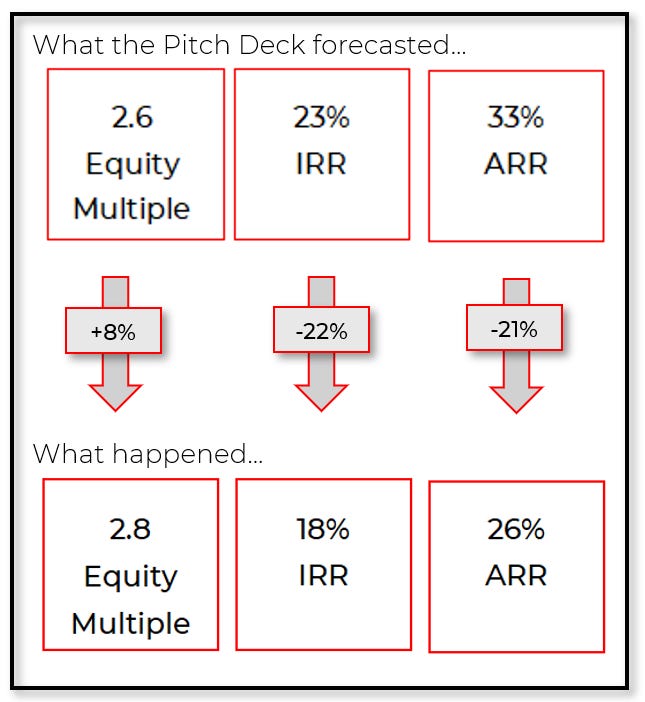
The returns have improved: the equity multiple increased from 2.0x to 2.8x (and outperformed the projected 2.6x), the IRR improved by 2 pt from 16% to 18% (but still fell well behind the projected 23%), and the ARR increased from 20% to 26% (but also fell behind the projected 33%). Maybe waiting was the right move?
Effect on Return Metrics
To understand how extending the timeline by 24 months actually improved investor results, let’s look at the numbers…
Note that:
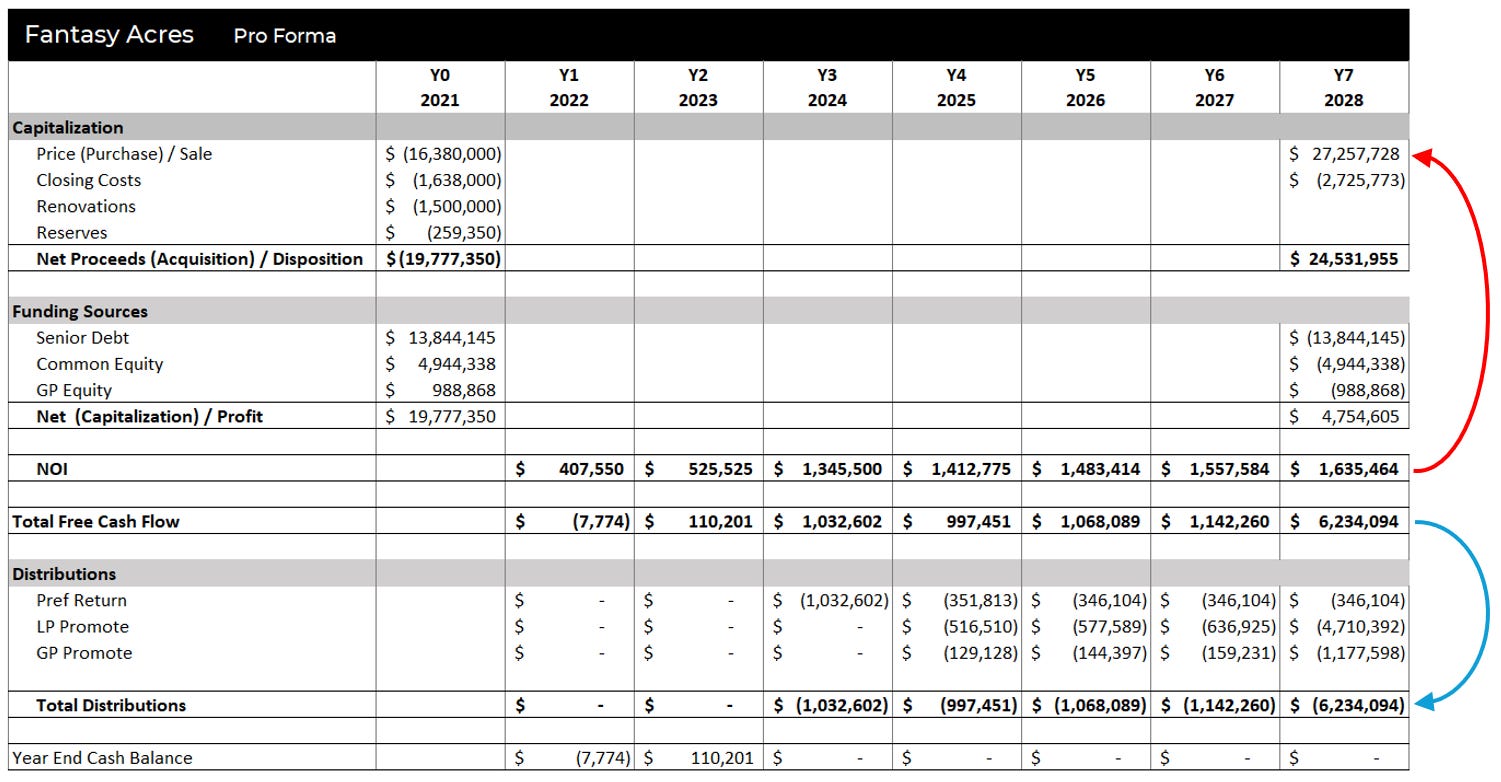
By holding all variables steady and only adjusting the timeline (and the expanded cap rate already accounted for), the NOI increases steadily year over year, which meaningfully improves the exit value (as shown by the red arrow) and free cashflow that boosted investor returns (as shown by the blue arrow). Here’s the math showing how that happened:
The final exit value was lifted to $27.3M from $24.7M in the previous scenario since the cap rate remained the same but the NOI increased from $1.5M in Y5 to $1.65M in Y7 (a larger number divided by the same number = a larger result). The NOI increased by ~$150,000 and 10%, but provided $2.5M and an equivalent 10% increase in value.
$1.5M (NOI) ÷ 6.0% (cap rate) = $25M*
$1.65M (NOI) ÷ 6.0% (cap rate) = $27.5M*
* rounded figures; actual metrics are as previously stated: $24.7M vs the rounded $25M; $27.3M vs the rounded $27.5M.
The free cashflow resulting from the value-add plan started yielding strong cashflow in Y3-Y7, which flowed through to investor distributions and ultimately buoyed the investor return metrics.
Remember: IRR is time sensitive. By returning cash to investors sooner via the strong cashflow in Y3-Y7, the IRR increases.
Equity multiple is NOT time sensitive. The actual amount of cash returned to investors did improve meaningfully via the strong cashflow of Y3-Y7, but a 2.8x multiple received in 7 years is not as valuable as a 2.6x multiple received in 5 years - which the IRR accounts for.
Conclusion for Today
Some metrics can be controlled, others not at all, and others are somewhere in between. NOI is one of the in between variables: subject to change based on market conditions and GP management decisions. Cap rates cannot be controlled; rates move freely with market conditions. Small changes in NOI and cap rates have the power to erode a property’s value - and investor returns. When considering this mathematical fact with the reality that future market conditions cannot be known in advance, the risk becomes apparent: no pro forma can predict investor returns and business plans that rely on favorable market conditions to persist into the future indefinitely are a high-risk gamble.
Real estate does NOT always appreciate. Riding out unfavorable market conditions can be the right choice. The numbers here verify both. However, surviving a market downturn can be difficult if not mathematically impossible.
The next post in this series, Market Corrections can be Avoided, will show what happens during a market correction when nearly every assumption is proven false and every number is off-target.
Anticipating the impacts of a market correction and showing how much margin for error the business plan permits is where sensitivity analysis comes in. That will be covered at the end of this series: How to use AI for Stress Testing and Sensitivity Analysis.