
DECODED: Using AI to Plot the Risk Radar
Understanding the risk position of an investment doesn't have to be mission impossible.

This is Decoded: AI tools for getting straight answers from complex investment documents.
This is the last in the introductory series to the Risk Radar. To learn more about the Risk Radar:
Read the Introduction
Read the Radar in Practice
Check out the podcast:
The Risk Radar paired with your preferred AI bot and NotebookLM makes comprehensive deal analysis more attainable and easier to understand.
This guide walks through using AI to do two jobs: gather the historical high, low, and average benchmarks to populate the rings of the Radar, and pull a deal’s pro forma assumptions out of the offering documents to plot against the market data.
Let’s go!
Part 1: Prepare the Risk Radar
Step 1: Download the Risk Radar
Download the Risk Radar here.
Step 2: Prepare the Radar for Plotting
You can print the Radar and write the relevant data onto it, mark it up as a PDF, or insert into a Word document to do the same. The point is to put the Radar into a format that works for you.
Step 3: Understand the Spokes
For each spoke of the Radar you need two things:
The market’s high, low, and average (as indicated by the spokes bisected by the black dashed line) for the asset type and submarket you are reviewing, and
The deal’s pro forma numbers.
To understand the mechanics of the Radar, review the following:
Read the Introduction
Read the Radar in Practice
Check out the podcast:
Important: The Risk Radar is structured to review a typical equity position in a single-asset deal.
It is NOT structured for debt or other funds that hold multiple assets and use a different business model.
Part 2: Plot the Historical Data
Using AI to Gather Historical Data
This is what makes the Risk Radar powerful - a visual representation of where the deal metrics fall in relation to historical metrics. But we’re going to have to use both NotebookLM and your preferred AI bot to get it done right: open one tab for each in your browser so you can easily navigate between the two tabs.
A Note About NotebookLM
Before diving into the details, it’s important to understand how NotebookLM operates.
Source data must be provided. NotebookLM does not source data independently; all information sources must be uploaded and marked as a source for it to be used to answer a prompt.
All data is weighted equally. NotebookLM cannot differentiate between the validity of a Reddit comment and a CoStar report. To compensate for this, we will only provide data from the GP in this step to avoid results muddled by potentially conflicting narratives presented in the GP’s materials and industry data reports.
Prompt length is limited. NotebookLM does not use project rules, only prompts - which cannot be too lengthy. To overcome this, the prompts provided here break the task down into sections.
Confidentiality is only maintained if feedback is not provided. If you’re concerned about confidentiality, do NOT click the thumbs up/down button.
Concerned about AI and confidentiality?
Step 1: Populate a new notebook in NotebookLM
Open NotebookLM and create a new notebook.
Pro Tip:
Name the notebook with the sponsor and deal so you can easily find it later.
This notebook can also be leveraged to understand deal performance, as outlined in Tackling the Paper Mountain.
Step 2: Gather and Upload the Documents
Gather everything the GP gave you and upload to the notebook. This may include:
The pitch deck and any marketing materials.
Complete package of subscription documents (OM, PPM, etc.).
Every quarterly report, financial statement, and investor update.
Any other relevant data - NotebookLM can read a wide variety of file types.
If you are evaluating a deal you have not subscribed to yet, the offering materials alone are enough to plot the Radar - that is the whole point of plotting it before investing, but the Risk Radar is also helpful to clarify the risk points of a current investment you may not have fully understood at the time you made the investment. Both uses are valid and offer learning opportunities.
Step 3: Check Legibility
It’s important to ensure NotebookLM can read what was provided. The following prompt provides a legibility check, but if a file is really corrupt it may come back as “unreadable” or may slip through without NotebookLM notifying you of its inability to read the information in the file.
AI is a tool - not a replacement for your own eyes and brain. Always verify.
You should get a response that looks like this:
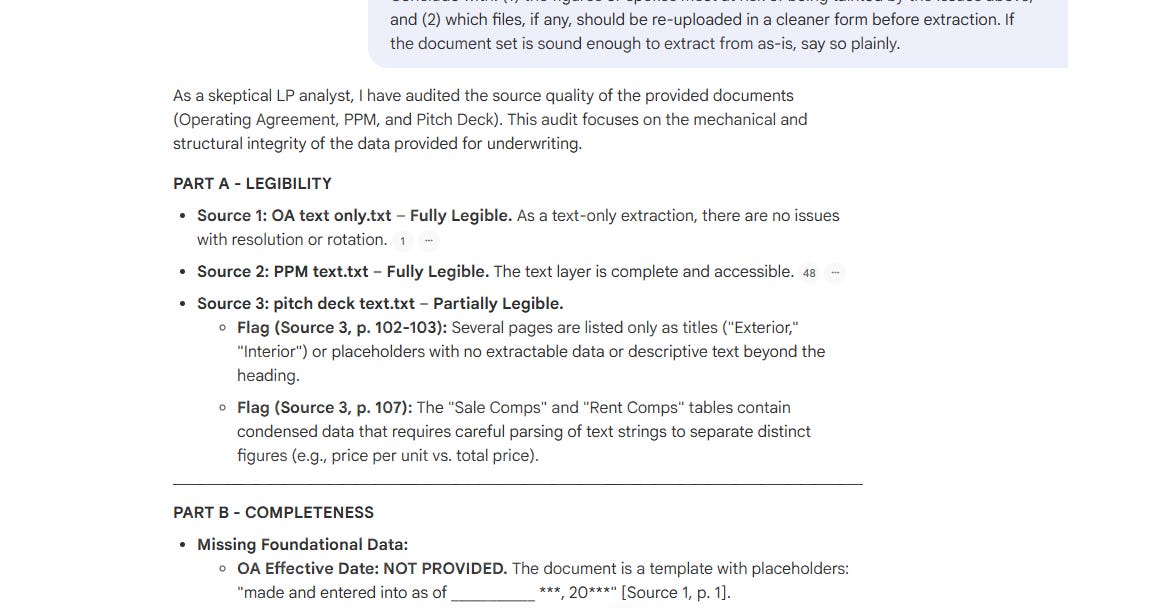
LEGIBILITY PROMPT:
Act as a skeptical LP analyst auditing the SOURCE QUALITY of the uploaded documents BEFORE any data is extracted. Work only from the uploaded files. Report in four parts.
PART A - LEGIBILITY
For EACH uploaded file, state: fully legible / partially legible / not legible. Flag specifically:
- pages that are image-only or scanned with no readable text layer
- blurred, cut-off, rotated, or low-resolution pages
- tables, charts, or maps whose figures are too small or distorted to read with confidence
- any file that is primarily photos with little or no extractable text
Name the file and page for each issue. If a file is fully clean, say so.
PART B - COMPLETENESS
Note anything missing or truncated that would limit analysis:
- documents referenced but not uploaded (exhibits, schedules, appendices, side letters, amendments)
- pages that appear to be missing from a sequence
- blank fields, “TBD,” or placeholder values where a figure is expected (e.g., DSCR “TBD by lender”)
- tables that are cut off before they end
PART C - CROSS-SOURCE CONSISTENCY
Cross-check the SAME figure across every source that states it (PPM, OA, pitch deck, any text-only versions, exhibits). Report every disparity with the value AND location of each version. Check at minimum: unit/door counts, total project value, offering size, sponsor co-investment, submarket inventory, rent and rent-growth figures, vacancy, reserves, loan amount, interest-rate description, and all fees. Distinguish a genuine conflict from a normal drafting progression (e.g., documents dated weeks apart).
PART D - INTEGRITY VERDICT
Conclude with: (1) the figures or spokes most at risk of being tainted by the issues above, and (2) which files, if any, should be re-uploaded in a cleaner form before extraction. If the document set is sound enough to extract from as-is, say so plainly.
Step 4: Start a new chat in Gemini/Claude/ChatGPT
Use the AI bot of your choice, and provide the following prompt.
PROMPT FOR HISTORICAL DATA:
Act as a CRE market analyst assembling benchmark market data for a limited partner.
DO NOT SEARCH YET. First ask me for the deal specs below, then STOP and wait. Do not assume or fill in any value I have not given you.
Ask me for:
Asset type (residential, commercial, hotel, etc.)
Size (unit count, square footage, or keys)
Submarket and metro
Asset vintage (year built; note any major renovation year)
After I answer, confirm the four back to me in one line. Then ask me one more question: the historical lookback period — 20, 30, or 50 years. Stop and wait. Once I answer, run the search below.
--- SEARCH (run only after I confirm specs and lookback) ---
Pull historical market data for the asset type, size, and submarket I gave you. For EACH metric report the observed range over my lookback period, plus the average and most recent reading. If a metric’s data does not reach that far back, use the longest available series and state its start year.
Then map each metric to the Risk Radar’s bands. On the radar the OUTER ring = highest risk and the INNER ring = lowest risk.
CRITICAL — RISK IS THE RISK OF THE PRO FORMA ASSUMPTION, NOT CURRENT MARKET CONDITIONS. A forward-looking assumption is risky when it bets on a favorable extreme holding (low supply, high demand, low vacancy, low expenses), because that leaves no cushion when the market reverts to the mean. The optimistic assumption is the OUTER (high-risk) band. Map the bands exactly as follows:
Purchase cap rate: LOW cap = outer/high risk (overpaying, thin basis); HIGH cap = inner/low risk.
Exit cap rate: same prevailing series as purchase — report ONE cap-rate series for both rows, no invented entry-to-exit spread. LOW = outer, HIGH = inner.
New supply: assuming LOW new supply = outer/high risk; assuming HIGH supply = inner/low risk.
Absorption (demand): assuming HIGH demand / fast absorption = outer/high risk; assuming LOW demand = inner/low risk.
Rental rate: assuming rent far ABOVE the market mean = outer/high risk; at or below mean = inner/low risk. Normalize across three bases: (a) per square foot, (b) per unit for the equivalent unit type/size, (c) asset-class standard (RevPAR for hotel). State each.
YoY rent growth: assuming HIGH growth = outer/high risk; flat or conservative = inner/low risk.
Vacancy: assuming LOW vacancy = outer/high risk; assuming higher/normalized vacancy = inner/low risk.
DSCR: LOW DSCR = outer/high risk; HIGH DSCR = inner/low risk.
LTV: HIGH LTV = outer/high risk; LOW LTV = inner/low risk.
Debt term: the interest RATE is not the risk — the TERM STRUCTURE is. Floating, or fixed for LESS than the planned hold = outer/high risk; fixed for at least the full anticipated hold = inner/low risk. Report the band in these terms, not as a rate range.
OpEx ratio: assuming LOW expenses = outer/high risk (optimistic, hard to sustain); assuming higher/normalized expenses = inner/low risk.
SUBJECTIVE SPOKES — no historical series exists. State the rule, not a data range:
Senior layers: a count of capital layers senior to the LP position. Outer/high risk = MORE than one senior layer; inner/low risk = fewer than one (LP sits directly behind a single senior loan or better). Note this is subjective.
Waterfall: subjective structural judgment. A CUMULATIVE preferred return is the lower-risk (inner) feature; a promote split with no preferred return (promote-only) is the higher-risk (outer) feature.
GP spokes (years as team, expertise, roaches) are EXCLUDED entirely — they are not market data.
OUTPUT — one table, this exact column order:
| # | Spoke | Outer Band (High Risk) | Inner Band (Low Risk) | Average | Most Recent | Geography Used | Data Start Yr | Source URL | Reliability |
Rows, clockwise:
Purchase cap rate
Exit cap rate (same series as #1)
New supply
Absorption
Rental rate (all three bases in the cell)
YoY rent growth
Vacancy
DSCR
LTV
Debt term
OpEx ratio
Reserves
Senior layers [subjective — state the >1 / <1 rule, no percentage]
Waterfall [subjective — cumulative pref = inner; promote-only = outer]
For reserves (#12): LOW reserves assumed = outer/high risk; ample reserves = inner/low risk. Report in both $/unit/yr and months of operating expenses.
After the table, add a short “Caveats” block: which spokes used metro/national proxies vs. true submarket data, and which rely on paywalled sources cited only secondhand.
RULES:
Cite a working source URL for every figure. Prioritize CoStar, Green Street, CBRE, JLL, Cushman & Wakefield, NCREIF, RCA/MSCI, and FRED. Exclude blogs, forums, and sponsor marketing.
National sourcing is correct-by-nature for the financing spokes (DSCR, LTV, debt term); hold the market spokes (cap rate, supply, absorption, rent, growth, vacancy) to submarket data or label the substitution.
If a gold-standard source is paywalled and only a secondhand citation is available, say so and rate reliability high/medium/low.
Where sources disagree, show the range; do not average.
If a metric cannot be sourced, say so plainly — do not estimate.
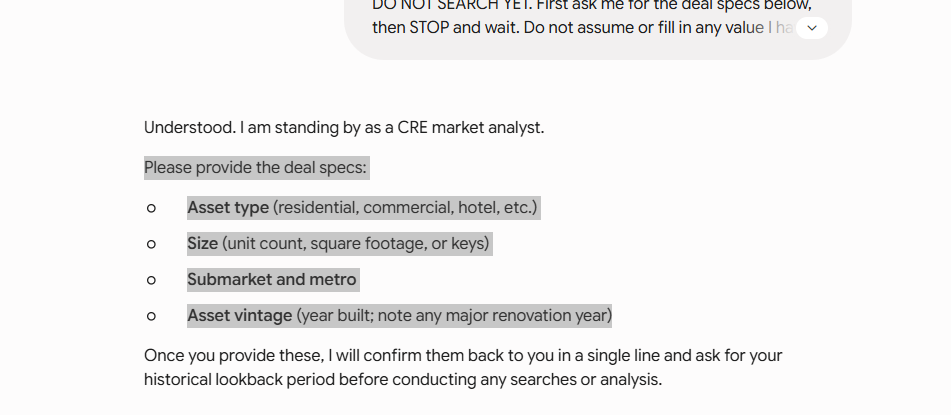
The bot will ask for the project details with a response that should look like this. Highlight the relevant text (as shown below in gray), then copy and paste into NotebookLM.
Step 5: Gathering the Details
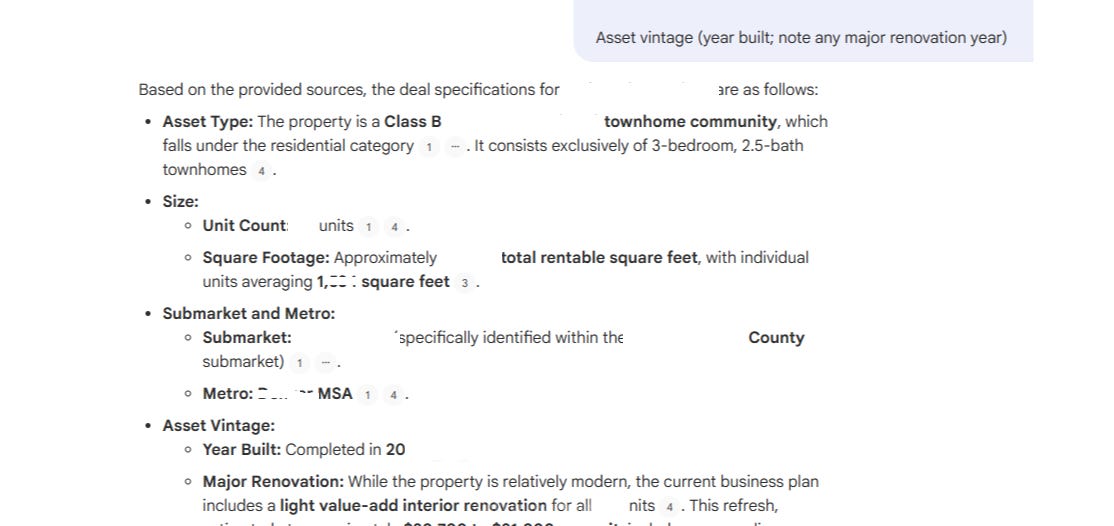
Copy and paste the information requested from your AI bot into the notebook. NotebookLM should give a response that looks like this, which you can now copy/paste back into your bot:
The bot will then ask one last question: your preferred time horizon. I use 50 years; others prefer 20 or 30 years. It’s your choice.
Step 6: Plot the Radar with the Historical Data
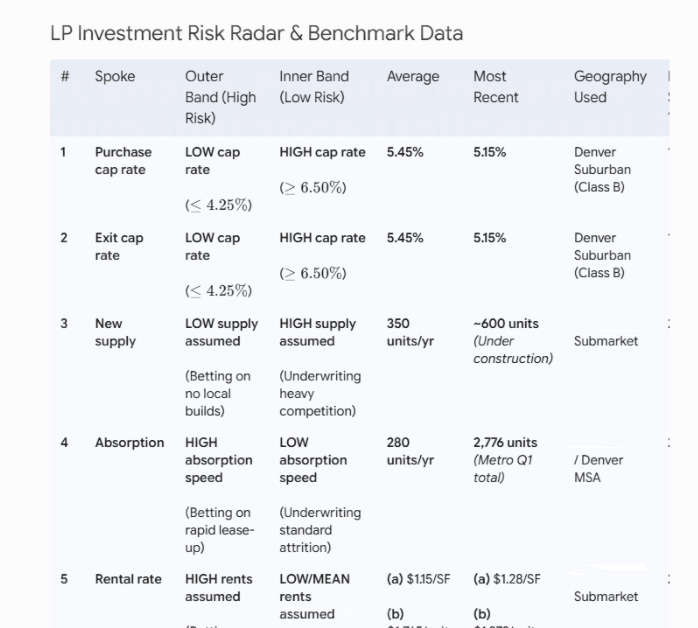
The AI bot will provide all the historical data needed to plot the rings of the Radar in a table that should look like the image below. You can now follow the table and populate the inner and outer rings of the Radar in clockwise order. In doing so, you will also gain a mental understanding of the historic and current market conditions for the deal.
A note on data
The best sources of market data - CoStar CCRSI, Green Street CPPI, full Preqin and NCREIF data - sit behind paywalls. When precision matters for a decision, consider paying for the CoStar or Green Street data.
Part 3: Plot the Deal
Step 1: Extract the numerical data
We are finally at the point where you can start putting dots on the Radar!
Go back to the notebook you set up in Part 2.
We will prompt for each section of the Radar - one at a time. You should get a response that looks something like the image below, which will allow you to plot a point for each spoke onto the Radar against the market data completed in the first step.
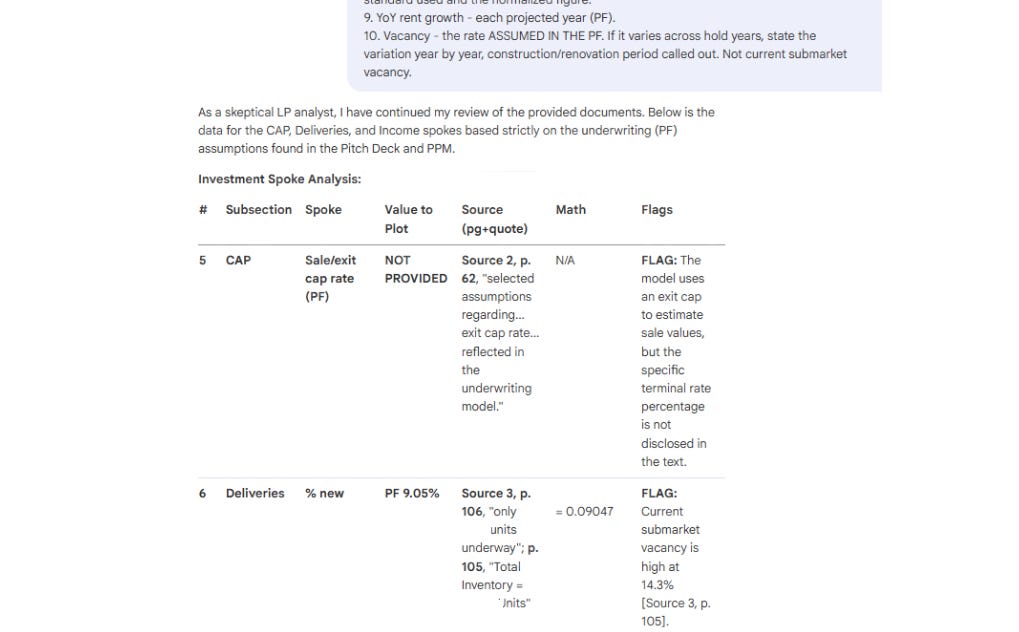
A few notes on reading the result:
“NOT PROVIDED” is a point. A deal that hides its basic financials is showing you a high-risk position. Plot a missing fundamental at the outer ring.
Ask for clarification as needed. Sometimes the data provided is not exactly what is asked. Ask follow-up questions to get what you need. And if all else fails, ask for the pages containing the information you are seeking, and look at the source document itself.
The Prompts
FIXED AT CLOSING:
Act as a skeptical LP analyst using ONLY the uploaded documents.
RULES (apply to this and my next two prompts):
- Cite source doc + page + short quote for every figure.
- Not stated → “NOT PROVIDED”; never estimate or infer.
- If a figure only resembles the one asked, flag it and give both.
- One figure per spoke; note conflicts.
- Show arithmetic for any calculation.
- “PF” = the pro forma’s own assumption at underwriting, NOT current/live market. Plot the PF value; note any current figure only as a flag.
Return these 4 spokes in THIS order. Table: # | Subsection | Spoke | Value to Plot | Source (pg+quote) | Math | Flags.
GP
1. Years as team - years the named principals have worked together as a unit; give firm age AND shared tenure separately, flag if only firm age stated.
2. Expertise - how broad/narrow across asset types, geographies, and business models. Return one value: FOCUSED (one of each), MODERATE (focus on one to two of the three), or DIVERSE (more than one in all three). State the count per dimension and the basis.
3. Roaches - any credible negative information about the firm or principals.
CAP
4. Purchase cap rate.
MARKET DRIVEN:
Same rules as the prior prompt. Return these 6 spokes in THIS order, same table format.
CAP
5. Sale/exit cap rate (PF).
Deliveries
6. % new - new inventory as % of existing submarket inventory (PF); show units / total. Not the current pipeline.
7. Absorption - in months (PF). Not the current pace.
Income
8. Rental rate - the PF rate normalized to the asset-class standard unit (rent/sq ft for multifamily, RevPAR for hospitality, NNN rent/sq ft for industrial/retail, etc.). State the standard used and the normalized figure.
9. YoY rent growth - each projected year (PF).
10. Vacancy - the rate ASSUMED IN THE PF. If it varies across hold years, state the variation year by year, construction/renovation period called out. Not current submarket vacancy.
SPONSOR DRIVEN:
Same rules as before. Return these 7 spokes in THIS order, same table format.
Debt
11. DSCR - with the NOI and annual debt service behind it.
12. LTV - report BOTH LTV on acquisition cost AND LTV on total capitalization (as applicable). If only Loan-to-Cost is stated, say so and give both.
13. Term - state the basic loan terms (e.g., “3-yr fixed + two 1-yr extensions”) AND the planned hold period, then the gap. Plot the EXPOSURE: a loan fixed 3 yrs on a 5-yr hold is fixed yrs 1-3, UNKNOWN yrs 4-5 (refinance/extension at then-current rates). Show: (a) maturity; (b) fixed duration, or if floating the index, spread, cap strike; (c) extension options + cost/conditions; (d) hold years EXPOSED after the fixed/cap period. If locked for full hold, say so.
Expenses
14. Expense as % of income - each projected year (PF), not just Yr 1.
15. Reserves - state BOTH the initial reserve in absolute dollars AND the months of operating expenses it represents (PF); show math.
Capital
16. Senior layers - list EVERY layer senior to the offered LP position, each with $ and % of total capitalization, and the total count.
17. Waterfall - preferred return (cumulative?) and the full promote split by tier.
Step 2: GP Data Points 2.0
The three GP spokes (years as a team, expertise, roaches) call for deeper research than just what the GP wants you to see in the offering materials, so we will take some additional steps.
Public Records Search
Use AI and/or Google to complete a public records search of the principals and the involved entities.
Navigate back to the bot used in Step 2, and use the following prompt.
GP BACKGROUND PROMPT FOR CLAUDE/GEMINI/CHATGPT:
Act as a due-diligence investigator vetting a real estate sponsor on behalf of a prospective limited partner. Search the open web and public records thoroughly. I need any credible negative information at three levels: the sponsor ENTITY (and affiliated/parent/management entities), the named PRINCIPALS, and other KEY STAFF (executives, fund managers, guarantors).
SUBJECTS:
- Entity/entities: [SPONSOR LEGAL NAME(S), DBA, AND AFFILIATES]
- Principals: [NAMES + TITLES]
- Key staff: [NAMES + TITLES]
- Helpful context: [HEADQUARTERS CITY/STATE, ASSET TYPES, APPROX. AUM/UNITS, YEARS ACTIVE]
SEARCH AND REPORT ON, AT MINIMUM:
1. Litigation - lawsuits as plaintiff or defendant, judgments, liens, foreclosures, deed-in-lieu, receiverships. Check federal (PACER-indexed) and state court mentions, and county records where surfaced.
2. Securities/regulatory - SEC actions, litigation releases, administrative proceedings; FINRA BrokerCheck and SEC IAPD records; state securities regulator actions; any Form D filings and whether offerings match claims. Check the SEC EDGAR full-text search.
3. Bankruptcy/insolvency - entity or personal filings, defaulted loans, CMBS special-servicing or delinquency mentions tied to their deals.
4. Investor complaints - LP grievances, capital-call disputes, alleged misrepresentation, on forums, news, BBB, Google/Yelp, and syndication communities.
5. Reputation/press - negative news, investigative pieces, fraud or mismanagement allegations, principals’ involvement in prior failed or troubled deals (including under other entity names).
6. Identity/background - prior business names, dissolved entities, name changes, undisclosed affiliations, or principals tied to unrelated controversies that bear on integrity.
RULES:
- Cite a working source URL for EVERY claim. No citation = do not include it.
- Distinguish CONFIRMED (a primary or reputable source directly states it) from UNCONFIRMED/ALLEGED (rumor, single forum post, unclear identity). Label each.
- Beware of NAME COLLISIONS - common names may return another person/company. Flag any item where you cannot confirm it is the same subject, and say what would disambiguate it.
- “Nothing found” is a valid, useful result. If a category is clean, say so explicitly rather than padding.
- Note the LIMITS of open-web search: paywalled dockets, sealed cases, and unindexed county records may not surface. Recommend where a manual PACER, county-recorder, or background-check pull is warranted.
OUTPUT:
- A findings table: Subject | Level (entity/principal/staff) | Category | Finding | Confirmed or Alleged | Source URL | Same-subject confidence.
- Then a short verdict for the radar’s “roaches” spoke: any credible negative information found (yes/no), the most material item, and what still needs manual verification.
If you don’t have access to the chat in Part 2 or the bot asks for the project details, use the following to easily get all the deal specs: go back to your notebook and ask the following. Then copy the response and send it back to your other AI bot to complete the search.
DEAL SPECS PROMPT:
Tell me the following details:
Sponsor Entity/Entities: [Insert legal name(s), DBAs, and any known parent/subsidiary companies]
Principals: [Insert names and titles, e.g., Jane Doe (CEO)]
Key Staff: [Insert names and titles of executives, fund managers, or key guarantors]
Helpful Context: [Insert headquarters city/state, primary asset classes (e.g., multifamily, retail), approximate AUM/unit count, and years active]
Online Libraries
Find online tools for screening GPs in the Resources Section.
Part 4: Radar Complete
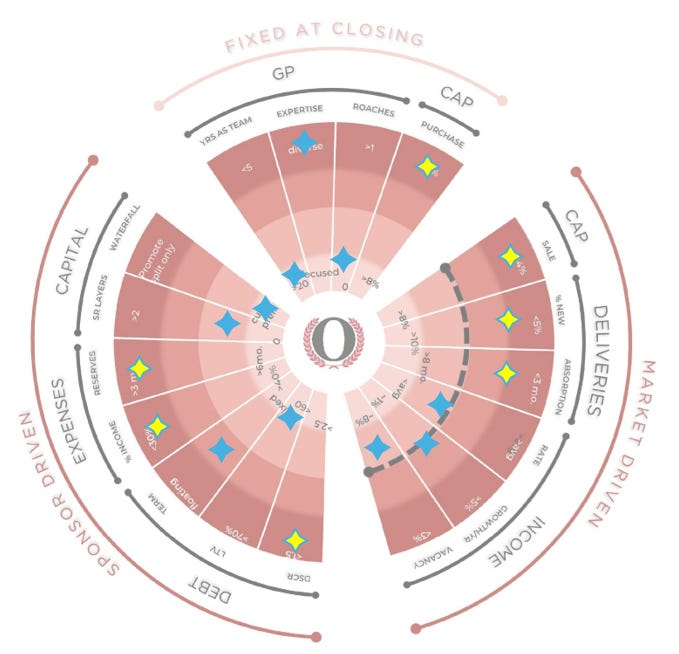
You should now have a complete picture for each spoke on the Radar that looks something like the image below. I used two different colored stars: the blue is for information provided by the pitch deck; the yellow marks information I had to extrapolate because it wasn't directly provided, which I am noting as a warning sign about the quality and transparency of the offering materials.
Why not use AI to plot the Radar?
I could provide a prompt that would fully automate this entire process. However, by manually noting the most important data - the historical market points and the deal’s assumptions - the mind is forced to engage with and internalize it.
This is a tool to facilitate critical thinking and analysis - not a replacement for it.
Keep in Mind
The Risk Radar is just that - a measurement of relative risk that is directional. Risk is not necessarily good or bad. The quality of the deal and its suitability against your objectives are not captured here - those are personal decisions you must evaluate on your own.
Try it and Share!
Does it work? Tell me if the Risk Radar and the AI instructions work, if they break, and ideas for improvement.
Educational and informational only. Not investment, legal, tax, or financial advice. Always verify AI output against primary sources and consult your own licensed professionals before making any investment decision.